A data-based look at executive functioning during OT evaluations
Occupational therapy practitioners often hear some version of the same question: “They seemed to do fine with you. Why are they struggling so much in class?”
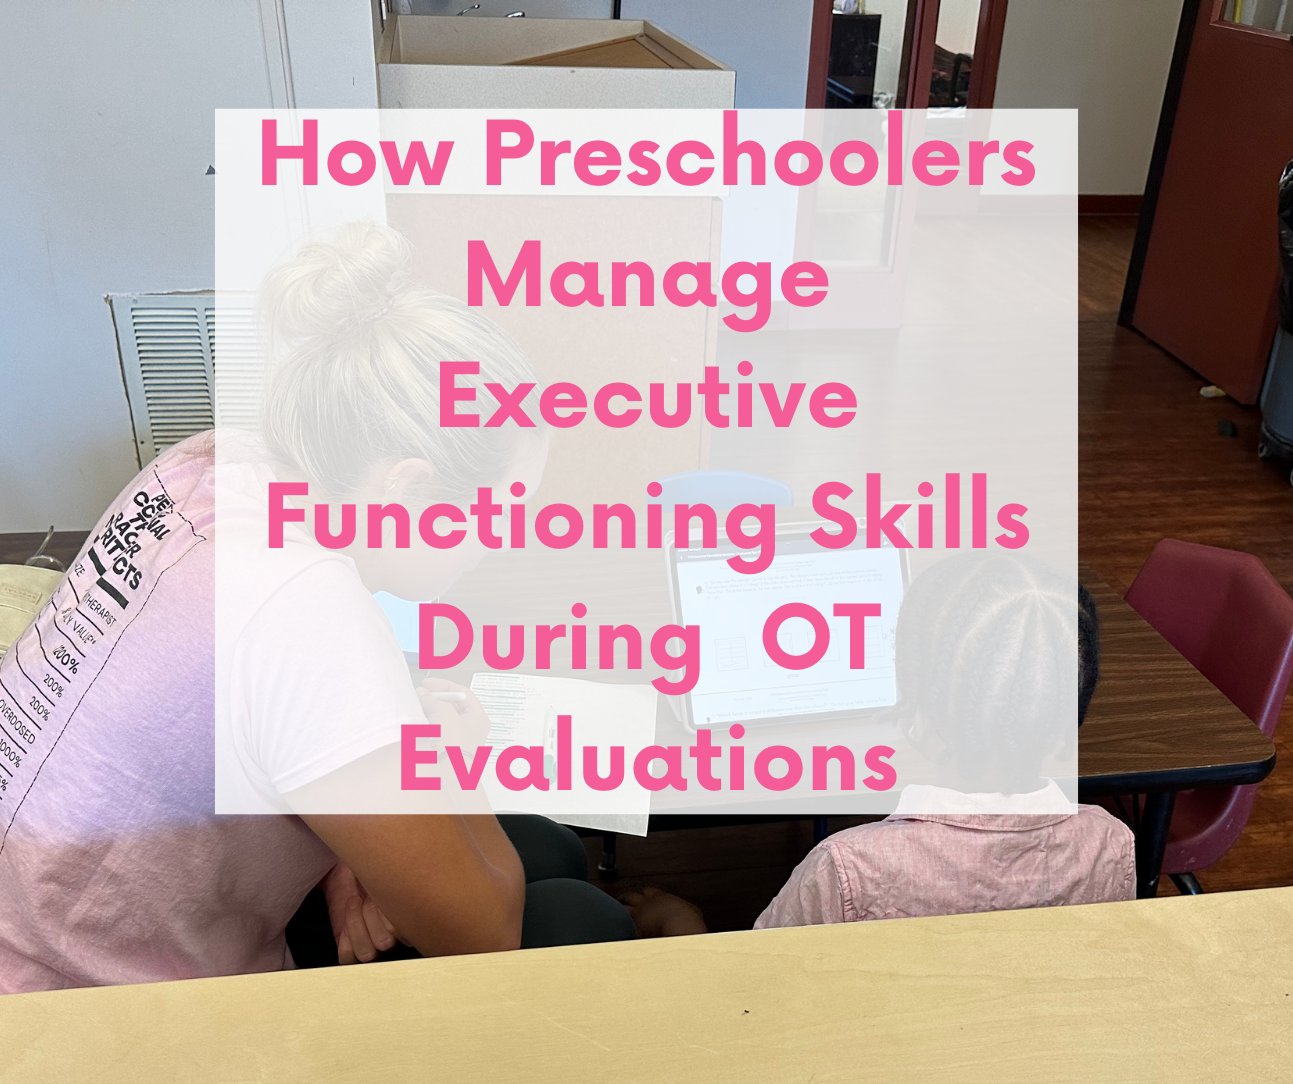
To explore this, we examined therapist-rated Executive Functioning collected during one-on-one OT evaluations with preschoolers. These ratings reflect how children worked with the therapist during the evaluation itself, not how they function in classrooms, group settings, or home environments.
This article focuses on what the data shows and how therapists can interpret these observations responsibly.
Important context about this sample
Children were referred for OT after failing an occupational therapy screening
400+ preschoolers aged 4:0-4:11 , with about equal % of males and females
This is a clinically referred preschool sample, not a normative group
Ratings reflect performance during a one-on-one OT evaluation
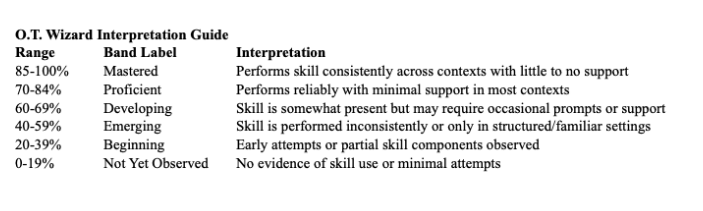
Work habits were rated using descriptive anchors:
Not present or Beginning
Inconsistent or Emerging
Developing
Proficient
Mastered
What the work habit data shows overall
Across all work habit areas, most children in this referred preschool sample were rated in the Developing to Adequate range when working one-on-one with an occupational therapist.
This suggests that many children who struggle in classrooms or group environments are able to participate meaningfully when demands are reduced, expectations are clear, and adult support is individualized.
How children performed across specific work habit areas
Transitions and cooperation
Most children were rated as Developing or Proficient in their ability to transition between activities and cooperate with the therapist during the evaluation.
This indicates that many preschoolers can adapt well to structured tasks when the environment is predictable and supportive, even if transitions are difficult in other settings.
Task initiation and task completion
Task initiation and task completion were commonly rated in the Developing to Proficient range.
Many children required prompting or encouragement to begin tasks, but were generally able to complete them once engaged. This reflects emerging executive functioning skills rather than refusal or lack of effort.
Impulse control and task persistence
Impulse control and task persistence tended to fall in the Developing range.
Children often attempted tasks and remained engaged for short periods but had difficulty sustaining effort across multiple activities. This pattern is typical in preschoolers and becomes more pronounced when task demands increase.
Attention during the evaluation
Attention was the most commonly impacted work habit, even in a one-on-one setting.
Many children were rated between Emerging and Developing for attention. This is an important clinical signal.
When a child struggles to attend during a one-on-one evaluation, they will generally struggle even more in larger, less structured settings such as classrooms, group activities, or busy home environments. Difficulty sustaining attention in a low-demand context often predicts greater challenges when environmental demands increase.
When poor evaluation performance reflects anxiety, not ability
It is also important to acknowledge that not all low work habit ratings reflect true functional ability.
Some preschoolers perform poorly during evaluations because they are:
Nervous
Anxious
Overwhelmed by unfamiliar adults or environments
Uncertain about expectations
In these cases, performance may underestimate a child’s true skills.
Occupational therapists play a critical role in distinguishing between skill limitations and emotional readiness. Establishing rapport is not optional. It is a clinical necessity.
For some children, establishing rapport may include:
Spending additional time building trust
Allowing the child to observe before participating
Using play or preferred activities to reduce anxiety
Delaying formal evaluation tasks until the child appears comfortable with the therapist
Evaluation data is only as meaningful as the context in which it is collected.
What this tells us about one-on-one OT evaluations in our 400+ preschool sample
Taken together, these findings suggest:
Most preschoolers in this referred sample can demonstrate Developing to Adequate work habits in a one-on-one OT evaluation
Stronger performance in this setting does not negate difficulties in classrooms or group environments
Attention difficulties observed in one-on-one contexts often signal more significant challenges in larger settings
Anxiety and lack of rapport can temporarily suppress performance and must be considered during interpretation
Why this matters for interpretation and communication
These data support a critical clinical message:
Performance in a one-on-one OT evaluation reflects what a child can do with individualized support, not what they are expected to manage independently in more complex environments.
When communicating results to families, teachers, and teams, it is essential to clarify the difference between supported performance and real-world participation demands.
Key takeaway for therapists
Based on therapist-rated work habit descriptors:
Most preschoolers in this referred sample demonstrated Developing to Adequate work habits during a one-on-one OT evaluation, while attention and self-regulation remained vulnerable areas, particularly when demands increase or anxiety is present.
This reinforces the importance of careful interpretation, thoughtful rapport building, and contextualized clinical judgment.
📣OTPs : Does this match your experience when evaluating preschoolers? Leave us a comment and let us know.
What the Draw-A-Person Task in O.T. Wizard Is Actually Showing Us
A data-based look at the Draw A Person Task in preschool OT evaluations inside O.T. Wizard.
Important context: The data presented here were drawn from preschool children who did not pass an occupational therapy screening and were subsequently evaluated. This sample is not a normative population and should not be interpreted as representative of typically developing preschoolers.
The Draw-A-Person task is a familiar tools in pediatric occupational therapy. It is widely used, information rich, and often referenced in evaluation reports. At the same time, many therapists find it challenging to interpret, especially when scores are low.
Rather than debating the value of Draw-A-Person conceptually, this article looks at how the task behaves in real evaluation data when it is administered consistently across a preschool sample. You may have heard of “The Good Enough Draw A Person” drawing assessment. The O.T. Wizard uses a similar but more simple version.
This analysis is descriptive only. No Rasch or item response modeling has been applied yet.
Sample overview
Number of evaluations included: 404
Approximate number of students: 404
Evaluations with Draw-A-Person data: 401
Total item-level data points across the evaluation system: 19,062
Referred clinical sample, not normative population
Draw-A-Person was part of the standard evaluation battery and was administered when the child tolerated the task. Missing responses were excluded rather than scored as zero.
Draw-A-Person scoring rubric
Draw-A-Person was scored using the following criteria:
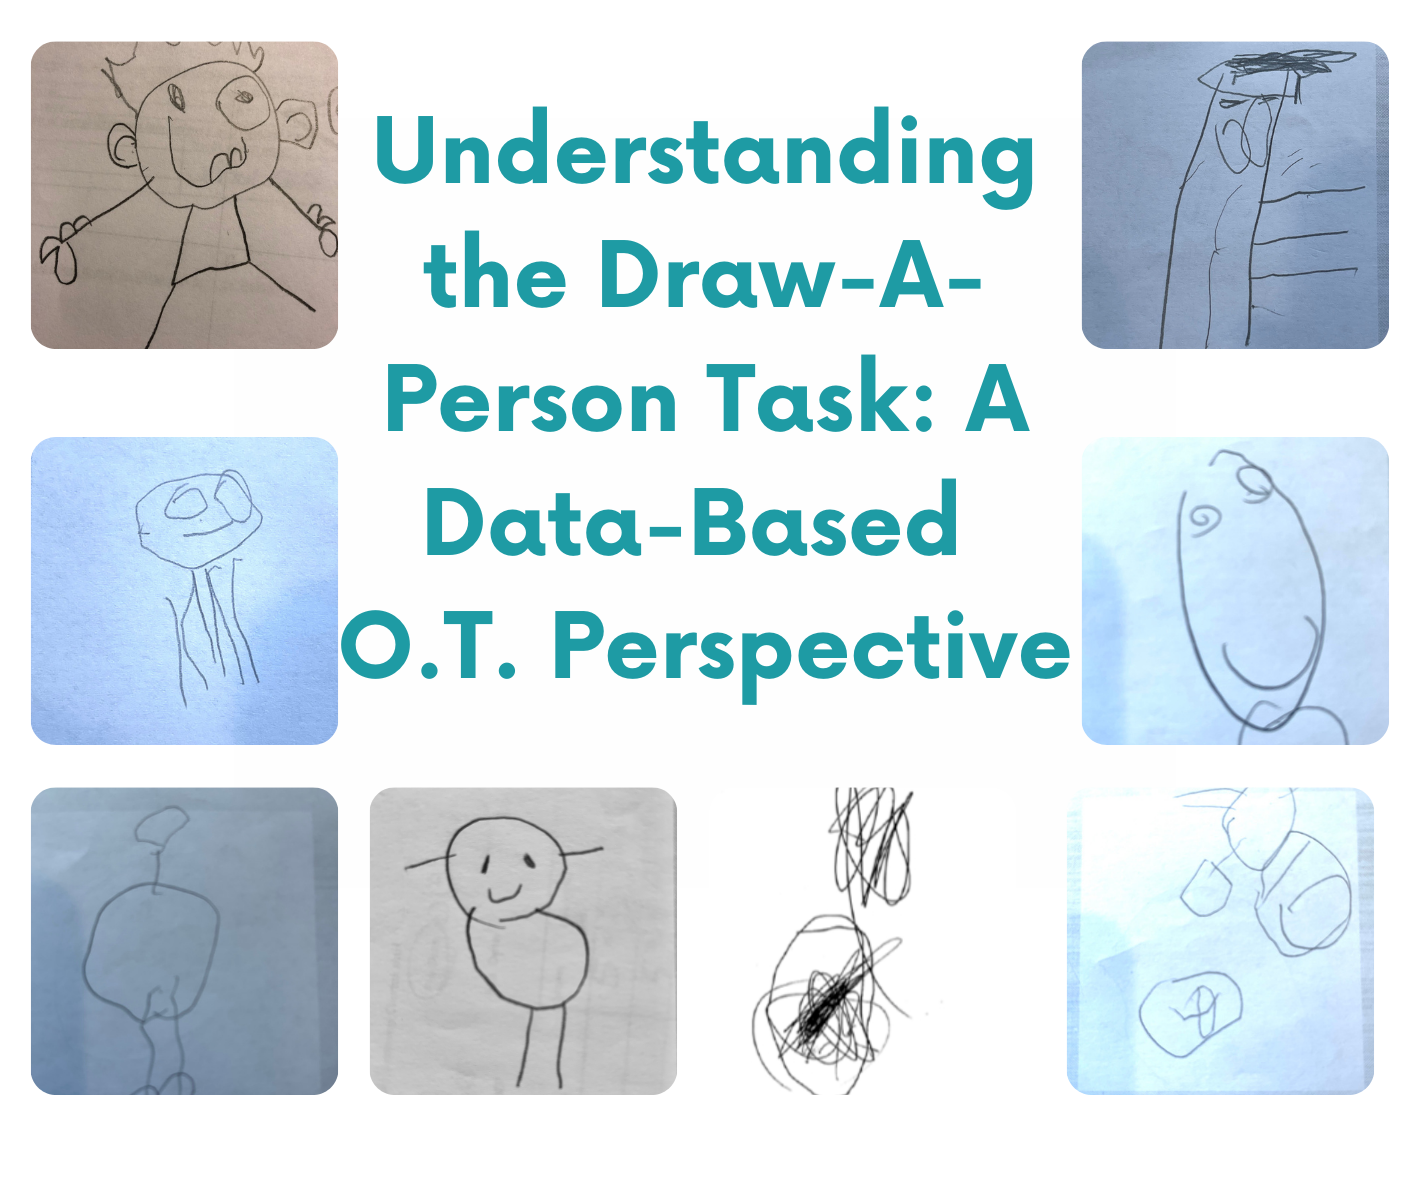
Score 0 (0.0): No approximations
Score 1 (0.2): Approximations emerge
Score 2 (0.4): Head and parts present but no body
Score 3 (0.6): Recognizable person with body and at least four body parts
Score 4 (0.8): Recognizable person with six or more body parts
Score 5 (1.0): Recognizable person with twelve or more body parts
It is important to note that even a score of 1 reflects emerging representational drawing rather than an absence of skill. The score was converted to a normalized score where a raw score of 5 = normalized score of 1.0 (most credit).
Average Draw-A-Person performance
Across the combined preschool sample:
Draw-A-Person scores were analyzed using normalized values derived from the scoring rubric. The average normalized score across the preschool sample was 0.38, corresponding to an average rubric level of approximately 1.9. Clinically, this places the average child between “approximations emerge” and “head and parts present but no body.”
While individual scores varied, this average suggests that most preschoolers in the sample demonstrated emerging representational drawing skills rather than fully recognizable figures
Distribution of Draw-A-Person scores
When responses are mapped directly onto the scoring rubric, the distribution looks like this:
Score 0, no approximations: 290 children, approximately 72 percent
Score 1, approximations emerge: 99 children, approximately 25 percent
Score 2, head and parts without a body: 7 children, approximately 2 percent
Score 3, recognizable person with body and at least four parts: 4 children, approximately 1 percent
Score 4, recognizable person with six or more parts: 1 child, less than 1 percent
Score 5, recognizable person with twelve or more parts: 0 children
This is a heavily floor-weighted distribution.
What this distribution tells us
In this preschool sample, most children did not produce a recognizable person. Nearly three quarters of children showed no recognizable approximations, and only a very small percentage produced a clearly recognizable person with a body.
Draw-A-Person age anchors suggest that by approximately 36 months, children often demonstrate a head with emerging parts, by 48 months a recognizable person with a body and multiple body parts, and by 64 months increasingly detailed human figures. In contrast, the average performance in this referred preschool sample falls between “approximations emerge” and “head and parts present but no body.” This indicates that, as a sample group, these children are demonstrating representational drawing skills that are less mature than would be expected based on age anchors, which is consistent with a population that did not pass an occupational therapy screening rather than a normative sample.
This helps explain why Draw-A-Person often feels like a difficult task for young children and why it frequently stands out in evaluation reports.
Why Draw-A-Person behaves differently than many other tasks
Compared to many visual perceptual, gross motor, or participation-based tasks, Draw-A-Person requires multiple skills to work together at once. These include visual motor integration, visual perception, motor planning, body awareness, fine motor control, and representational thinking.
Because of this high level of integration, Draw-A-Person tends to function as a high-threshold task. It separates children who are beginning to integrate these skills from those who are not yet developmentally ready to do so.
The data supports what many therapists experience clinically. Draw-A-Person is informative, but it should not be interpreted in isolation.
Interpreting Draw-A-Person results responsibly
Based on this data, several points are important for clinical interpretation:
Low Draw-A-Person scores are common in preschoolers
Progress from score 0 to score 1 is clinically meaningful
Scores of 3 or higher represent a small minority of children
Draw-A-Person should be interpreted alongside visual perceptual, fine motor, praxis, and participation data
Whether the task is developmentally ambitious, exhibits a floor effect, or is a candidate for item misfit will be evaluated during future Rasch analysis. At this stage, the data supports careful, contextual interpretation rather than over-weighting the score.
Why this matters for practice
Most therapists have an intuitive sense that Draw-A-Person is hard for young children. Very few have seen how strongly that intuition is reflected in actual data.
Seeing the full distribution helps recalibrate expectations and supports clearer communication with parents, teachers, and teams. It also reinforces the importance of viewing Draw-A-Person as one piece of a much larger evaluation picture.
As this dataset grows and formal psychometric analysis is completed, these descriptive patterns will be tested and refined. For now, they provide a grounded, data-anchored explanation for why Draw-A-Person feels the way it does in real preschool OT evaluations.
From time to time, we invite occupational therapy practitioners whose use of OT Wizard reflects strong clinical reasoning, real-world application, and thoughtful feedback to participate in a spotlight.
User spotlight with Hailey, OTR/L
Can you tell us a little about your background as an OTP, and your work setting(s) ?
I am currently in my 6th year as an OT and all 6 have been within the school-based setting. I have dabbled in outpatient pediatrics, as well, by my heart is absolutely within school-based delivery.
Do you have a favorite domain or type of challenge you enjoy treating most? What do you love about it?
I would say that visual deficits are my favorite challenge; they’re often easily missed or overlooked, but play such a foundational role in the development of motor skills.
What does a “normal” day look like for you?
This year specifically, I am balancing a lot of evaluations and supervision of COTAs (I have an amazing team of COTAs)! I also spend time bouncing between pre-k classrooms and treating a handful of pre-k and elementary aged students.
How did you hear about OT Wizard?
Our school-based therapy team registered for the Learning Charms Conference this past fall. As soon as the platform was presented, we knew we needed to be utilizing it. We’ve had no regrets!
Before subscribing to OT Wizard, what made you hesitant about trying OT Wizard?
We’re so accustomed to only reaching for standardized assessments that have been around for decades or piecing together an informal observation checklist. Also, I was a little intimidated by the AI feature.
What made you feel OT Wizard could work in your setting(s)?
After learning about the time, experience, and dedication that was poured into creating this tool, I felt a lot more comfortable with the idea of it. Hearing the statistics regarding efficiency, along with the opportunities for collaboration within the profession, made me even more sure.
Was there a moment where OT Wizard really “clicked” for you?
I would have to say that it clicked after I had the chance to utilize it with a few students, alongside each COTA on our school-based team. Familiarizing myself with the platform, each task I was asking the students to do, and the various forms and report generators was key. Stephanie has also made this whole platform SO user friendly; frequently sending helpful tips, new features and asking for feedback.
How has OT Wizard changed your approach to evaluations or reports now, even in small ways?
I walk into an evaluation feeling much more prepared, knowing that I have a variety of evaluation tools at the click of a button. I have also enjoyed the report generator; I’m still old school and like to type my own report first, but the verbiage of the wizard has definitely improved my end result.
What is your favorite feature in OT Wizard?
I’ve LOVED using the (digital) forms that can be sent to teachers, specifically the sensory one. It’s so comprehensive, and the summary of results is easy to interpret and present to IEP team members.
What would you say to another OTP who’s feeling hesitant or skeptical about trying OT Wizard?
DO IT! Don’t think twice! There are so many incredible features that can be utilized across pediatric settings.
What’s one thing you don’t miss doing since using OT Wizard?
Creating the eligibility justification. OT Wizard generates a well-worded, individualized statement, based on all of the data collected on the specified student.
In addition to what Hailey mentioned, she’s been a champion for using many, if not all of the features within OT Wizard. She reaches out when she has questions and is diligent in making sure she understands best practice use. For these reasons, this OT Wizard hat is well deserved.
I’m thrilled to announce that OT Wizard has officially begun psychometric validation through Rasch analysis – a major milestone in our journey to elevate evidence-based practice in pediatric occupational therapy!
What’s Happening Now
We’ve sent evaluation data for ages 4-5 years (Age Bands H & I) to an independent psychometrician for comprehensive analysis. With over 400 evaluations from 18 therapists across North Carolina, we have robust data to validate that OT Wizard measures what we say it measures & accurately, reliably, and fairly.
What Is Rasch Analysis?
Rasch analysis is a sophisticated psychometric approach that goes beyond traditional test validation. Unlike norm-referenced assessments that simply compare students to each other, Rasch analysis creates an interval-level measurement scale, similar to measuring temperature or weight.
Think of assessments you may know that use Rasch methodology:
HELP (Hawaii Early Learning Profile) – Rasch-validated developmental assessment
Original PEDI – Rasch-based functional assessment
These assessments are considered gold standards because Rasch analysis ensures:
Equal intervals: A 10-point gain at any level represents the same amount of growth
Sample-independent measurement: Item difficulty doesn’t depend on who takes the test
Missing data handling: Scores are valid even when not all items are administered (adaptive testing)
Precise error estimation: Know exactly how confident you can be in each score
Item hierarchy validation: Confirms items are developmentally sequenced correctly
Why Rasch Instead of Traditional Norming?
Traditional norm-referenced tests (like BOT-3, PDMS-3) require testing typically-developing children to create percentile ranks. That’s valuable, but has limitations:
Norms become outdated (tests re-normed every 15-20 years) Percentiles are ordinal, not interval (85th→95th ≠ 15th→25th in actual ability) Can’t track growth accurately across different ability levels Require complete test administration
Rasch analysis provides:
Continuous measurement scale – Track growth precisely over time Adaptive testing – Administer only relevant items, still get accurate scores Sample-independent – Item difficulty stays stable regardless of who’s tested Living calibration – Can update and refine continuously with new data Clinical utility – Scores directly interpretable for intervention planning
We’re building OT Wizard to work like the PEDI-CAT and AMPS. These are tools that OTs trust because they’re built on rigorous Rasch foundations.
What We Already Know About Our Data
Before even sending data to our psychometrician, we conducted preliminary analysis on our 404 evaluations to ensure data quality. Here’s what we’ve learned:
Strong Sample Characteristics
Well-balanced age distribution: 184 evaluations (ages 4.0-4.4) and 220 evaluations (ages 4.5-4.9)
18 therapists contributing: Average of 22 evaluations each, with range of 7-45 per therapist (good for inter-rater reliability)
Diverse language backgrounds: 90% English, 8% Spanish, 2% other languages
Clinical population validity: 96% recommended for OT services
Excellent Data Completeness
Zero missing responses – every administered item was answered
75.5% average completion rate – our adaptive basal/ceiling rules are working perfectly
19,062 total data points across 74 items and 8 domains
Strong Domain Coverage
Visual Perception: 15 items
Activities of Daily Living: 14 items
Gross Motor & Fine Motor: 10 items each
Participation: 9 items
Executive Functioning: 8 items
Visual Motor Integration: 5 items
Praxis: 3 items
Areas for Improvement Identified
Our preliminary analysis flagged several items for the psychometrician to examine closely:
Ceiling Effects in Visual Perception (Preschool evaluation): 56% of responses scored at ceiling (mastered), with 33% at floor (not yet observed). This bimodal pattern suggests we may need more mid-difficulty items to better differentiate students in the middle range.
Rating Scale Consistency: A small number of responses (3.3%) showed raw scores instead of normalized scores, indicating a formula issue we’ve already corrected.
Developmental Anchor Gaps: About 54% of items (primarily Executive Functioning and Participation domains) lack developmental anchors. The Rasch analysis will empirically determine difficulty levels so we can assign appropriate anchors.
Item-Age Alignment: Many items administered are anchored above student age ranges (51-55% above range). This is actually expected and appropriate. Students with developmental delays are working on skills typically seen at older ages. However, Rasch will help us recalibrate anchors based on clinical population performance vs. typical development.
Best-Performing Domains
ADL: Excellent distribution with only 8% floor and 8% ceiling – items are well-targeted
Executive Functioning: Minimal floor effect (0.7%), good spread across ability levels
This preliminary work means we’re sending clean, robust data to our psychometrician. This is maximizing the value of the Rasch analysis and ensuring reliable results.
What’s Being Analyzed
Our psychometrician is conducting comprehensive Rasch analysis across multiple dimensions:
1. Construct Validity (Unidimensionality)
Do items within each domain (Gross Motor, Fine Motor, Visual Perception, etc.) measure a single, coherent construct? This is critical for Rasch – if items don’t “hang together,” they can’t be on the same measurement scale.
2. Item Fit
Which items contribute to reliable measurement? Rasch provides specific fit statistics (infit/outfit MNSQ) showing whether each item:
Is too predictable (doesn’t add information)
Is too unpredictable (confuses the measurement)
Functions optimally (contributes to precise measurement)
Items outside acceptable ranges get flagged for revision or removal.
3. Rating Scale Functioning
Do our 5-point performance bands (Beginning → Mastered) function as intended? Rasch examines:
Are all categories used appropriately?
Do response thresholds advance in the right order?
Should categories be collapsed (e.g., 5-point → 3-point)?
This is similar to how AMPS validates its 4-point scoring scale.
4. Item Hierarchy
Rasch places all items on a single difficulty scale (measured in logits). We’ll see if:
Items anchored at 48 months are empirically easier than 54-month items
Our developmental sequencing matches actual difficulty
Gaps exist where we need additional items
This will be especially important for items currently lacking developmental anchors – the Rasch analysis will tell us where they belong.
5. Measurement Precision
Unlike traditional reliability (one number for whole test), Rasch shows precision at every ability level:
Where is measurement most accurate?
What’s the standard error at our 70% clinical threshold?
Can we distinguish between students with small ability differences?
6. Differential Item Functioning (DIF)
Do items work the same way for:
Boys vs girls?
4-year-olds vs 5-year-olds?
English vs Spanish speakers?
Different diagnoses?
Items showing bias get flagged or removed – ensuring fairness.
7. Person Separation
Can we reliably distinguish between students at different ability levels? Rasch provides a separation index showing how many distinct ability levels we can measure. Higher separation = more precise clinical distinctions.
8. Addressing Known Issues
The psychometrician will specifically examine:
Visual Perception’s ceiling effects : do we need additional mid-difficulty items?
Praxis domain with only 3 items : is this sufficient or should it combine with another domain?
Executive Functioning and Participation rating scales : do they function as separate constructs from performance-based items?
Why This Matters for You
Rasch validation transforms how you can use OT Wizard scores:
Meaningful Progress Monitoring
Because Rasch creates interval-level measurement, you can confidently say:
Traditional percentage scores can’t make these claims and a jump from 40% to 50% isn’t necessarily the same growth as 70% to 80%.
Adaptive Testing Validation
Like the PEDI-CAT and AMPS, OT Wizard uses basal/ceiling rules so students aren’t frustrated with too-hard items or bored with too-easy ones. Rasch analysis confirms:
Scores are comparable even when different items are administered
Our 75% completion rate is optimal
Missing items are appropriately “not administered,” not missing data
Credible Clinical Decisions
When you document that a child’s gross motor ability is at -1.2 logits:
School districts understand the methodology (same as PEDI-CAT/HELP)
You can defend your clinical reasoning with published psychometric evidence
Item-Level Interpretation
Rasch analysis creates item hierarchy maps showing exactly which skills a child has mastered, which are emerging, and which aren’t yet present. This directly informs intervention planning just like how AMPS users identify specific ADL breakdowns or PEDI-CAT shows functional skill patterns.
Why Start with Ages 4-5?
We strategically chose this age range because:
Sufficient sample size: 400+ evaluations provide robust statistical power for Rasch analysis
Diverse representation: Students with various diagnoses, languages, and ability levels
Multiple raters: 18 different therapists ensure inter-rater reliability analysis
Item overlap: Many items in this age range also appear in adjacent ages, so findings inform the entire platform
Strong data quality: Our preliminary analysis confirmed excellent completion rates and coverage
The psychometrician will identify any problematic items, validate our developmental anchors, assign anchors to items missing them, and ensure rating scales function optimally. We’ll implement improvements before these issues cascade into other age bands.
What Happens Next
Based on the psychometrician’s findings (expected in 4-5 weeks), we’ll:
Remove or revise misfitting items that don’t meet Rasch fit criteria
Add mid-difficulty items to Visual Perception domain to address ceiling effects
Optimize rating scales if analysis shows categories aren’t functioning as intended
Recalibrate existing anchors if clinical population performance differs from typical development
Establish measurement precision estimates at different ability levels
Publish validation statistics you can cite in reports and presentations
This refined version becomes the foundation for validating additional age bands.
Expanding Validation: Ages 3 Months to 12 Years
Over the next 12 months, as we reach 200+ evaluations per age band, we’ll validate each additional age group. This will create a comprehensive, linked measurement system similar to how PEDI-CAT links across age ranges where we can:
Track individual students across multiple years on the same logit scale
Provide age-equivalent scores based on item difficulty calibration
Create clinical reference data comparing students receiving OT services
Document growth trajectories with true interval-level measurement
Demonstrate outcomes with unprecedented precision
By Month 12, we’ll conduct a comprehensive linking study that places all age bands (3 months through 12 years) on a single, continuous measurement scale. Items that appear in multiple age bands will “anchor” the scales together, ensuring continuity.
This approach mirrors how major Rasch-based assessments (PEDI-CAT, AMPS, HELP) maintain measurement continuity across ages and versions.
How You Can Support This Work
1. Keep Using OT Wizard
Every evaluation you complete contributes to our growing database. Rasch analysis becomes more robust with larger samples and the more data we collect, the more confident we can be in item calibrations.
Brittany B., administers an eval with OT Wizard
2. Share Your Clinical Insights
If you notice items that seem:
Confusing or ambiguous to score
Too easy or too hard for the age range
Misaligned with what you observe clinically
Culturally biased or inappropriate
Please let us know! Your real-world feedback is invaluable. Rasch analysis will identify statistical misfits, but your clinical judgment helps us understand why items aren’t working.
What This Means for Our Profession
Most therapy documentation tools rely on subjective clinical observation. While tools like PEDI-CAT, AMPS, COPM, and HELP exist and use Rasch methodology, they’re limited in scope and focus on narrow or specific functional domains, requiring specialized training, or covering narrow age ranges.
OT Wizard is different: We’re creating a comprehensive, Rasch-validated clinical intelligence platform that covers:
Birth through early adulthood (3 months – 18 years)
Performance-based, participational based, and functional assessment
Integrated into everyday clinical workflow
By pursuing rigorous Rasch validation, we’re increasing psychometric rigor to comprehensive pediatric OT assessment.
When this validation is complete, you’ll be able to say:
“I use OT Wizard, a comprehensive Rasch-validated pediatric OT assessment platform with published psychometric evidence across 2,000+ evaluations providing the same measurement quality as tools like PEDI-CAT and AMPS, but covering all developmental domains.”
The Vision: Living Calibration and Real-Time Data
Here’s what excites me most about Rasch methodology: Unlike traditional norm-referenced tests that become frozen in time, Rasch-calibrated assessments can be continuously refined.
The PEDI-CAT has demonstrated this – as more data is collected, item calibrations can be updated, new items added, and measurement precision improved all while maintaining the same measurement scale.
OT Wizard will have “living calibration”:
Continuous item refinement as we collect more data
New items added to fill gaps in difficulty coverage
Real-time quality monitoring
Annual recalibration studies
Regional and demographic analyses
Imagine:
Item difficulties that reflect current populations
Outcome analytics showing which interventions are most effective
Predictive data identifying which early skills best predict later success
The world’s largest real-time Rasch-calibrated pediatric development database
Every evaluation you complete contributes to this unprecedented resource.
Thank you for building the future of evidence-based OT assessment with O.T. Wizard.
From time to time, we invite occupational therapists whose use of OT Wizard reflects strong clinical reasoning, real-world application, and thoughtful feedback to participate in a spotlight. These OTP’s have earned their wizard hats.
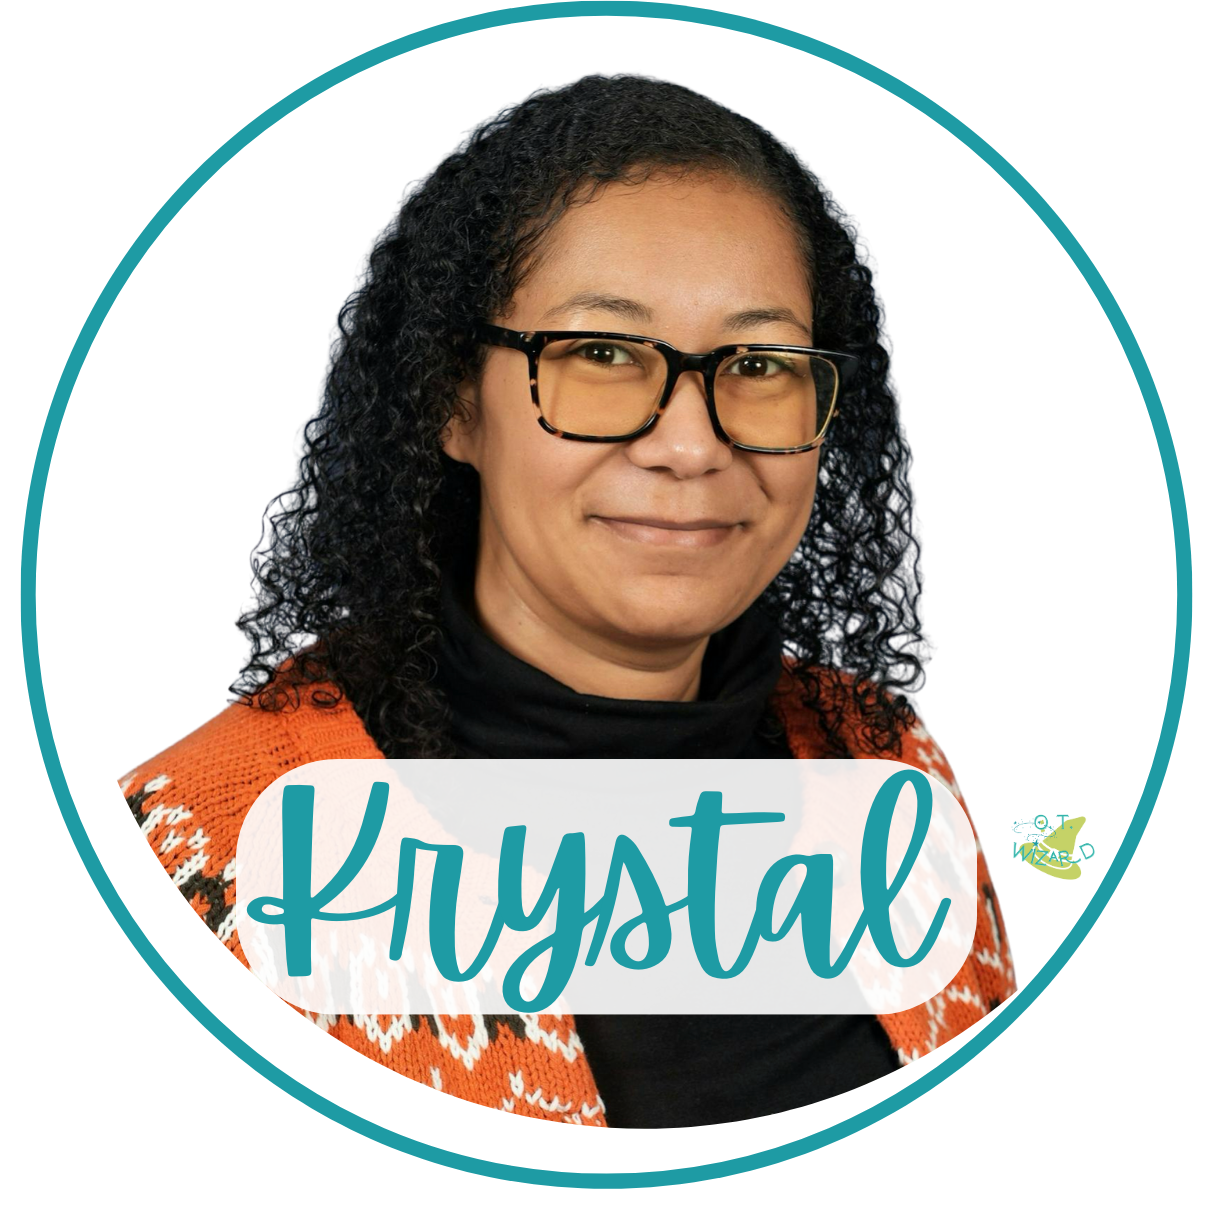
Meet Krystal Watkins, MS, OTR/L, ADSCS
Can you tell us a little about your background as an OTP, and your work setting(s) ?
I am an Occupational Therapy Practitioner with 8.5 years of experience working across a wide range of settings. My background includes skilled nursing facilities (SNF), acute care, outpatient therapy, early intervention, home health, and school-based practice, which has given me a strong clinical foundation. Over time, my passion has increasingly focused on pediatric practice, particularly working with children with autism and ADHD in educational and community-based settings. I enjoy supporting students’ sensory processing, self-regulation, attention, and functional participation to help them succeed in their daily routines at school and home. I am eager to continue growing professionally and look forward to pursuing additional certifications related to ADHD to further strengthen my ability to support this population.
Do you have a favorite domain or type of challenge you enjoy treating most? What do you love about it?
My favorite domain to work in is supporting students with autism and ADHD in school-based settings. What I love most about this work is how meaningful and practical it is. I enjoy helping students build the regulation, attention, sensory processing, and executive functioning skills they need to participate successfully in their daily school routines. Every child is different, and I find it rewarding to problem-solve creatively whether that means adapting the environment, using sensory-based strategies, or breaking tasks down so a student can experience success. I’m especially passionate about empowering students to better understand their own needs and strengths while collaborating closely with teachers and families. Seeing a child gain confidence, independence, and improved participation in the classroom even through small but significant gains is what makes this work so fulfilling for me.
What does a “normal” day look like for you?
As a school-based occupational therapist, a “normal” day is a balance of planning, direct treatment, and collaboration. I typically start my day by treatment planning and organizing materials to prepare for the students on my caseload. Throughout the day, I provide direct OT services to students, working on goals related to sensory regulation, fine motor skills, executive functioning, and classroom participation. In addition to treatment sessions, I regularly conduct evaluations and re-evaluations, complete documentation, and adjust intervention plans as needed. Collaboration is a key part of my daily routine. I spend time communicating with teachers, support staff, and other members of the school team to problem solve strategies and ensure consistency across environments. Each day is busy and varied, but the mix of hands on work, planning, and teamwork makes the role both dynamic and rewarding.
How did you hear about OT Wizard?
I heard about OT Wizard through a COTA friend who shared their experience and recommended it to Rockingham County Schools.
Before subscribing to OT Wizard, what made you hesitant about trying OT Wizard?
I wasn’t hesitant at all. I was actually excited to try something new and explore a tool that could support my work as an OT.
What made you feel OT Wizard could work in your setting(s)?
I felt OT Wizard could work well in my school-based OT setting because it provides practical resources and tools that directly support my work with students. Having access to ready to use evaluations helps me save planning time, stay organized, and tailor therapy to each child’s needs. It integrates seamlessly into a busy school day, where balancing evaluations, direct therapy, and collaboration with teachers is essential.
Was there a moment where OT Wizard really “clicked” for you?
Yes, there was a moment where OT Wizard really “clicked” for me when I realized how much time it could save on planning and documentation. I was able to quickly pull a ready to use evaluation and immediately tailor it for a student, all while feeling confident that it was thorough and appropriate.
How has OT Wizard changed your approach to evaluations or reports now, even in small ways?
Yes, It allows me to focus more on interpreting results and planning meaningful interventions rather than spending excessive time formatting or creating forms. Overall, it’s made the process more efficient, thorough, and less stressful, so I can dedicate more energy to supporting my students.
What is your favorite feature in OT Wizard?
My favorite features in OT Wizard are the Magic W.A.N.D. and the occupational profile section in the guided evaluations. The Magic W.A.N.D helps assess and identify writing difficulties. The Magic W.A.N.D. gives clear, structured insight into a student’s writing challenges. The occupational profile offers self-reflection type of questions that engage students in their own progress and provide valuable information about their perspectives, strengths, and needs. Both features make evaluations more interactive and meaningful.
What would you say to another OTP who’s feeling hesitant or skeptical about trying OT Wizard?
Give it a try! OT Wizard is designed to make your work easier, more organized, and more student-centered. The ready to use evaluations, tools, and resources save planning time and help you focus on what really matters which is supporting your students’ progress.
What’s one thing you don’t miss doing since using OT Wizard?
I don’t miss spending hours creating and formatting evaluation forms and reports from scratch. With ready to use templates and tools, I can focus on interpreting results and planning interventions instead of getting bogged down in paperwork. It’s been a huge time-saver and stress-reliever!
In addition to what Krystal shared here, she has been a beta tester of both OT Wizard v1 and v2, demonstrating flexibility and patience as the platform evolved. Throughout that process, she consistently showed curiosity and a willingness to learn new technology in service of her clinical work. For these reasons, this OT Wizard hat is well deserved.
This new evaluation template is now available in O.T. Wizard. The Adaptive Participation Evaluation is designed for children who have difficulty tolerating traditional testing. It uses developmental milestones, caregiver and/or teacher input, and therapist observations to provide a functional profile of participation and emerging skills. It is specially for children functioning at ages 18 months-60 months.
You’ll find a combination of age normed questions where the OTP will answer based on direct observation or by the teacher/caregiver’s report. Each response can be answered as “not yet”, “emerging” or “mastered”.
Evaluation domains include:
Gross Motor, Fine Motor, ADL’s, Social Emotional, Stereotypical Behaviors, Participation, Environmental Factors, and Occupational Profile.
Once you have entered the information, you may generate a report for medical model or educational model. After about 45 seconds you will have a polished report in your hand with metrics and scoring bands for each area, score summary, interpretation & functional impact, eligibility & medical/educational justification, SMART goals, Recommendations/Strategies, suggested POC/service time and Accommodations.
If you are a USA based occupational therapy practitioner, you likely already know that its been YEARS since insurance companies have increased our fee schedule. A fee schedule is the contractural arrangement in which occupational therapy is reimbursed by insurance companies. Medicare is the main player and their fee schedules set precedent for Medicaid and commercial insurance payers.
I can really only speak to North Carolina Medicaid since its the only state I’ve ever billed insurance, but I’m guessing this may feel like other states.
North Carolina Medicaid Hasn’t Kept Up: What OT Codes Pay vs. What It Costs (2010 → today)
North Carolina moved to managed care in 2021, but most outpatient OT clinics still feel like we’re billing 2008 in a 2025 economy. The fee schedule tells the story.
The receipts (NC Medicaid / NCTracks)
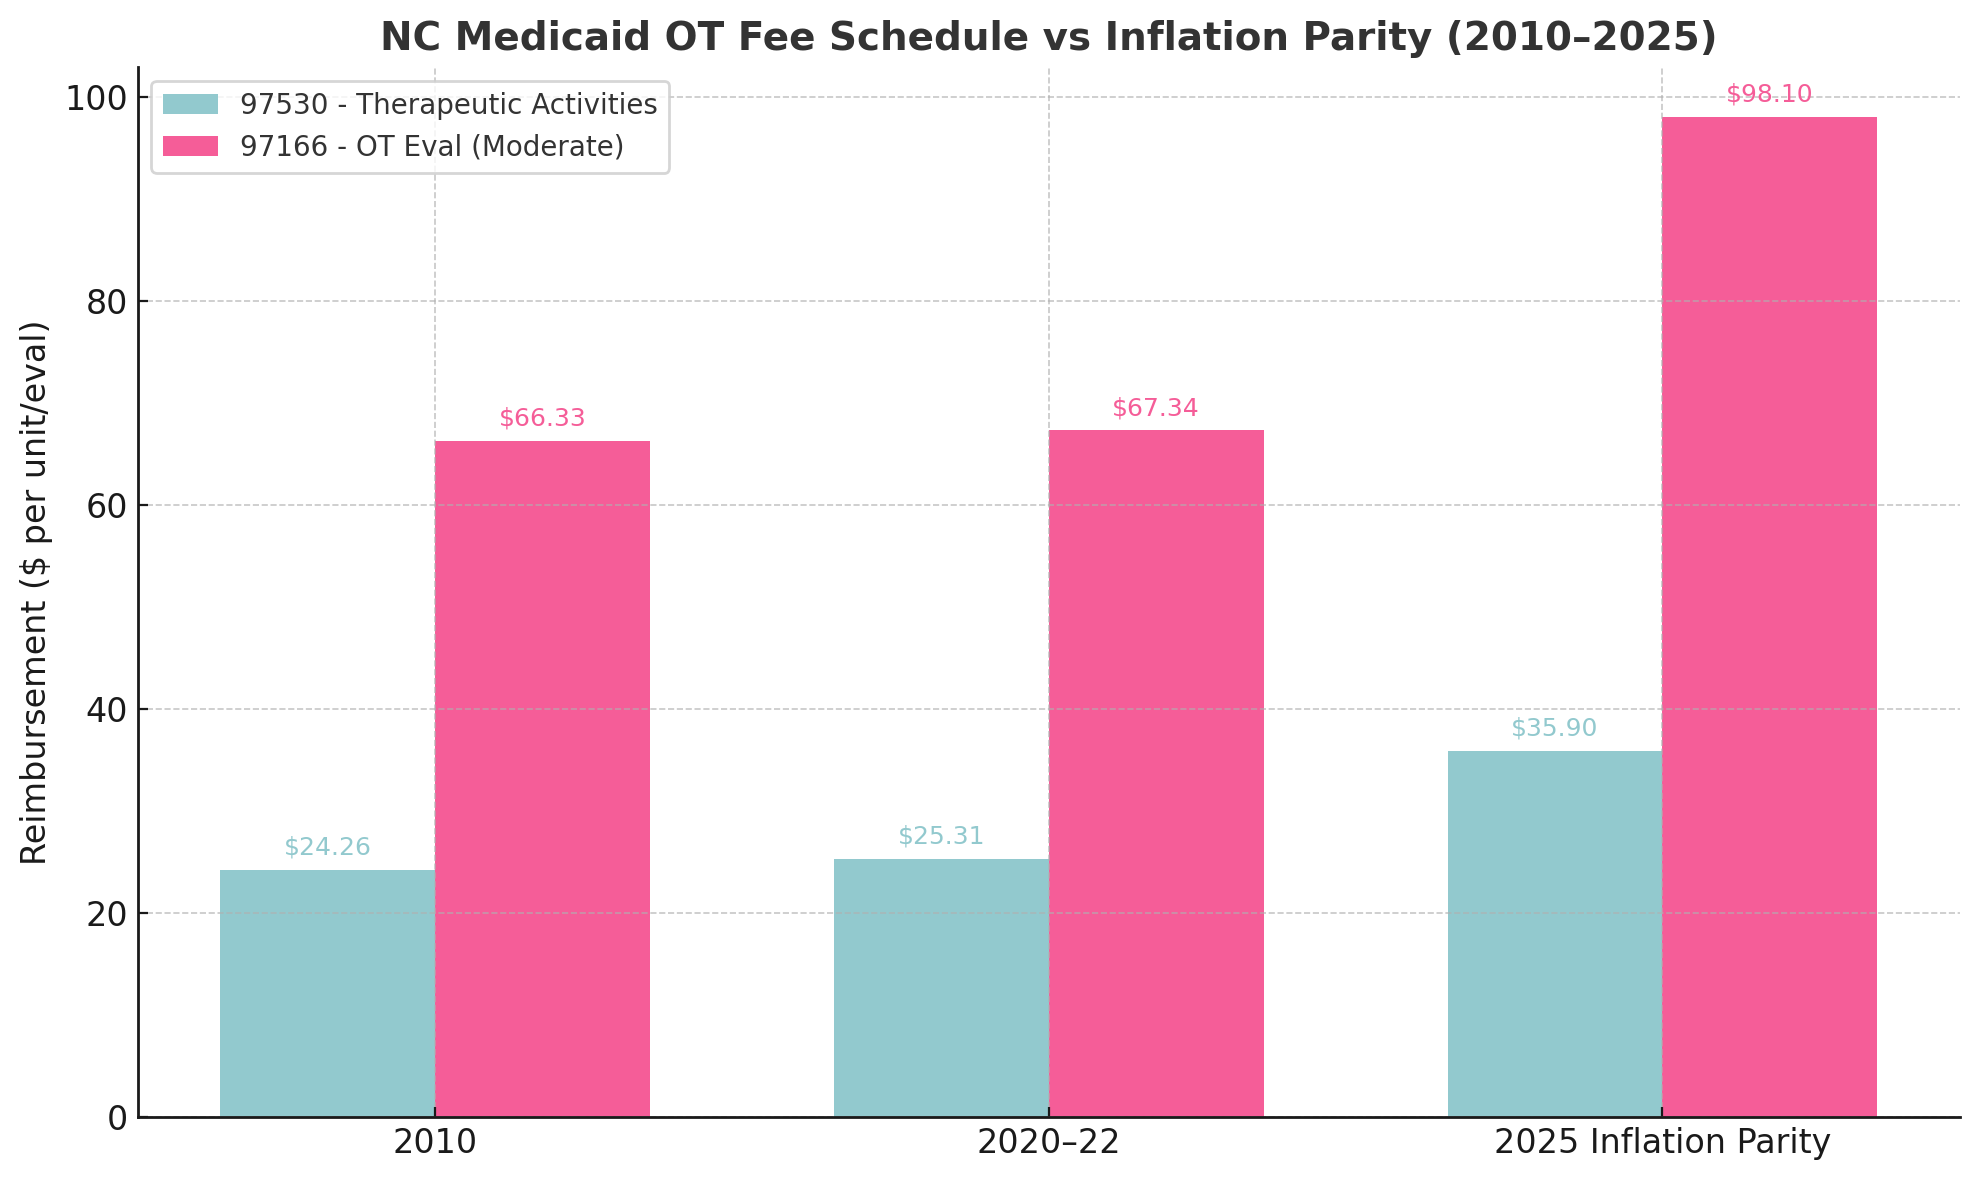
Therapeutic activities (97530):
$24.26 per 15-min unit in 2010 (non-facility). NC Medicaid
$25.31 per 15-min unit in 2020–2022 (non-facility). NC Medicaid
97166 (moderate): $67.34 in 2020–2022. NC Medicaid
Net change: +$1.01 (nominal)
Context: NC Medicaid went live with managed care July 1, 2021. Plans use contracted rates with rate-floor fee schedules in their contracts, but the published fee schedules still function as the practical baseline most clinics see.
What those dollars mean in 2025
Inflation since 2010 ≈ 48%. $1 in 2010 needs ≈ $1.48 today to break even. In 2013 Dollars
Translate that to therapy:
97530 would need to be ≈ $36 today just to equal its $24.26 value in 2010 (24.26 × 1.48 ≈ 35.9). NC Medicaid’s $25.31 is ~30% short of inflation parity. (Math shown; inflation source above.) NC Medicaid+1In 2013 Dollars
97166 would need to be ≈ $98 today to equal $66.33 in 2010 (66.33 × 1.48 ≈ 98.1). Current $67.34 is ~31% under inflation parity. NC Medicaid+1In 2013 Dollars
Since 1998, general prices have nearly doubled (+98%). So if OT rates were flat or near-flat in the 2000s, the real value of an OT unit has been cut roughly in half. In 2013 Dollars
“Real-life” clinic math (why it feels impossible)
Typical medical practice overhead runs 60–70% of revenue (rent, admin, software, insurance, billing, supplies, taxes). 99mgmt.com
OT wages: BLS shows $98,340 U.S. median (May 2024); NC average ≈ $94,580. That’s about $45–$47/hour before benefits. Bureau of Labor StatisticsO*NET OnLine
Put it together for Medicaid 97530 at $25.31/unit (four units/hour = $101.24/hour gross):
Overhead (60–70%): $60–$71/hour out the door. 99mgmt.com
Leftover to pay your OT’s wage+benefits: $30–$41/hour — below typical fully-loaded clinician cost. Net: you lose money unless productivity is pushed past what’s clinically sane, or non-Medicaid payers subsidize Medicaid.
For comparison, Medicare pays roughly mid-$30s per unit for 97530 nationally in 2024 (varies by locality). That’s still tight, but it’s notably higher than NC Medicaid’s ≈$25. empoweremr.comCenters for Medicare & Medicaid Services
The blue is what the fee schedule IS and the pink is where it should be in order to account for inflation.
Other providers got raises (and why that matters)
Primary care & dental: NC Medicaid raised primary care rates to Medicare levels and dental +10% in recent years to stabilize access. North Carolina Files
Behavioral health: In Nov 2023, the state announced “first time in a decade” increases across mental health/SUD/I/DD/TBI. NC DHHSAxios
2025 House budget (proposal): 3% Medicaid increases for several provider groups, including speech-language therapy, optometry, podiatry, etc. (OT wasn’t explicitly listed in that report). North Carolina Health News
Takeaway: North Carolina is willing to adjust rates when access is at risk — but outpatient OT hasn’t seen commensurate, inflation-aware updates in its core codes.
Why “managed care” didn’t fix it (yet)
Managed care adds care-coordination, quality metrics, and the possibility of state-directed payments and rate floors, but it doesn’t magically lift base OT rates. Plans still anchor to state fee baselines unless you negotiate. If OT can prove avoidable costs reduced and functional outcomes improved, you’ve got leverage for above-floor rates.
How NC OTs Can Advocate (and win) in 2025
1) Lead with evidence that speaks payer-language
Metrics that resonate with Medicaid and health plans:
Time to functional milestone (e.g., goal attainment within X visits).
Care intensity → outcome curve (doses/units vs. gains).
Episode cost and reduced downstream spend (fewer ED visits, less specialty escalation, shorter LOS after surgery).
School/IEP-relevant gains (attendance, participation) for kids covered under EPSDT — align to policy language. NC Medicaid
2) Use O.T. Wizard as a longitudinal outcomes engine
This is where OT Wizard can be your differentiator:
Standardize eval templates to capture baseline participation & function (COPM/GOAL-ATTAINMENT or your preferred measure) and auto-score session-level progress.
Track cohorts across diagnosis, age, frequency, modality (clinic/home/tele).
Auto-generate quarterly payer dashboards: time-to-goal, units per successful episode, no-show rate impact, discharge status, re-referral rates.
Build pre/post comparisons on commonly denied diagnoses to show where 15–30% more units drive measurable functional gains (and where they don’t).
3) Make a targeted rate ask
For NC Medicaid Direct: reference the documented stagnation — 97530 and evals are ~30% below inflation parity from 2010. Ask for an inflation alignment step-up (e.g., $36/unit target for 97530). NC Medicaid+1In 2013 Dollars
For Managed Care plans: request above-floor OT carve-outs or value-based add-ons using your outcomes package. Point to recent BH & primary care raises as precedent that the state is willing to move rates when access is at stake. NC DHHSAxiosNorth Carolina Files
4) Coalition up
Partner with PT & SLP peers and pediatric systems to show waitlists, turnover, and geographic gaps tied to low OT rates.
Bring parent/teacher testimonials plus quantified access delays (days to eval; cancellations due to network gaps).
Align with legislative interest: point to the 2025 House budget considering rate bumps for other services (ask, “Why not OT?”). North Carolina Health News
5) Keep the policy receipts handy
Cite NC’s managed care launch and rate-floor guidance to show plans have levers; you’re asking them to use those levers for OT. NC Medicaid+1
Anchor your “ask” to CPI (BLS) so it’s not an emotional plea; it’s math. In 2013 Dollars
Bottom line
NC Medicaid’s 97530 and OT eval amounts have barely budged nominally since at least 2010; in real dollars, they’ve fallen ~30% versus inflation. NC Medicaid+1In 2013 Dollars
The state has shown it will raise rates (primary care, dental, behavioral health) to protect access — OT should be next. North Carolina FilesNC DHHS
Use OT Wizard to produce longitudinal outcome evidence and push for inflation-aligned floors (and plan-level add-ons) so clinics can actually hire, retain, and serve. 💕
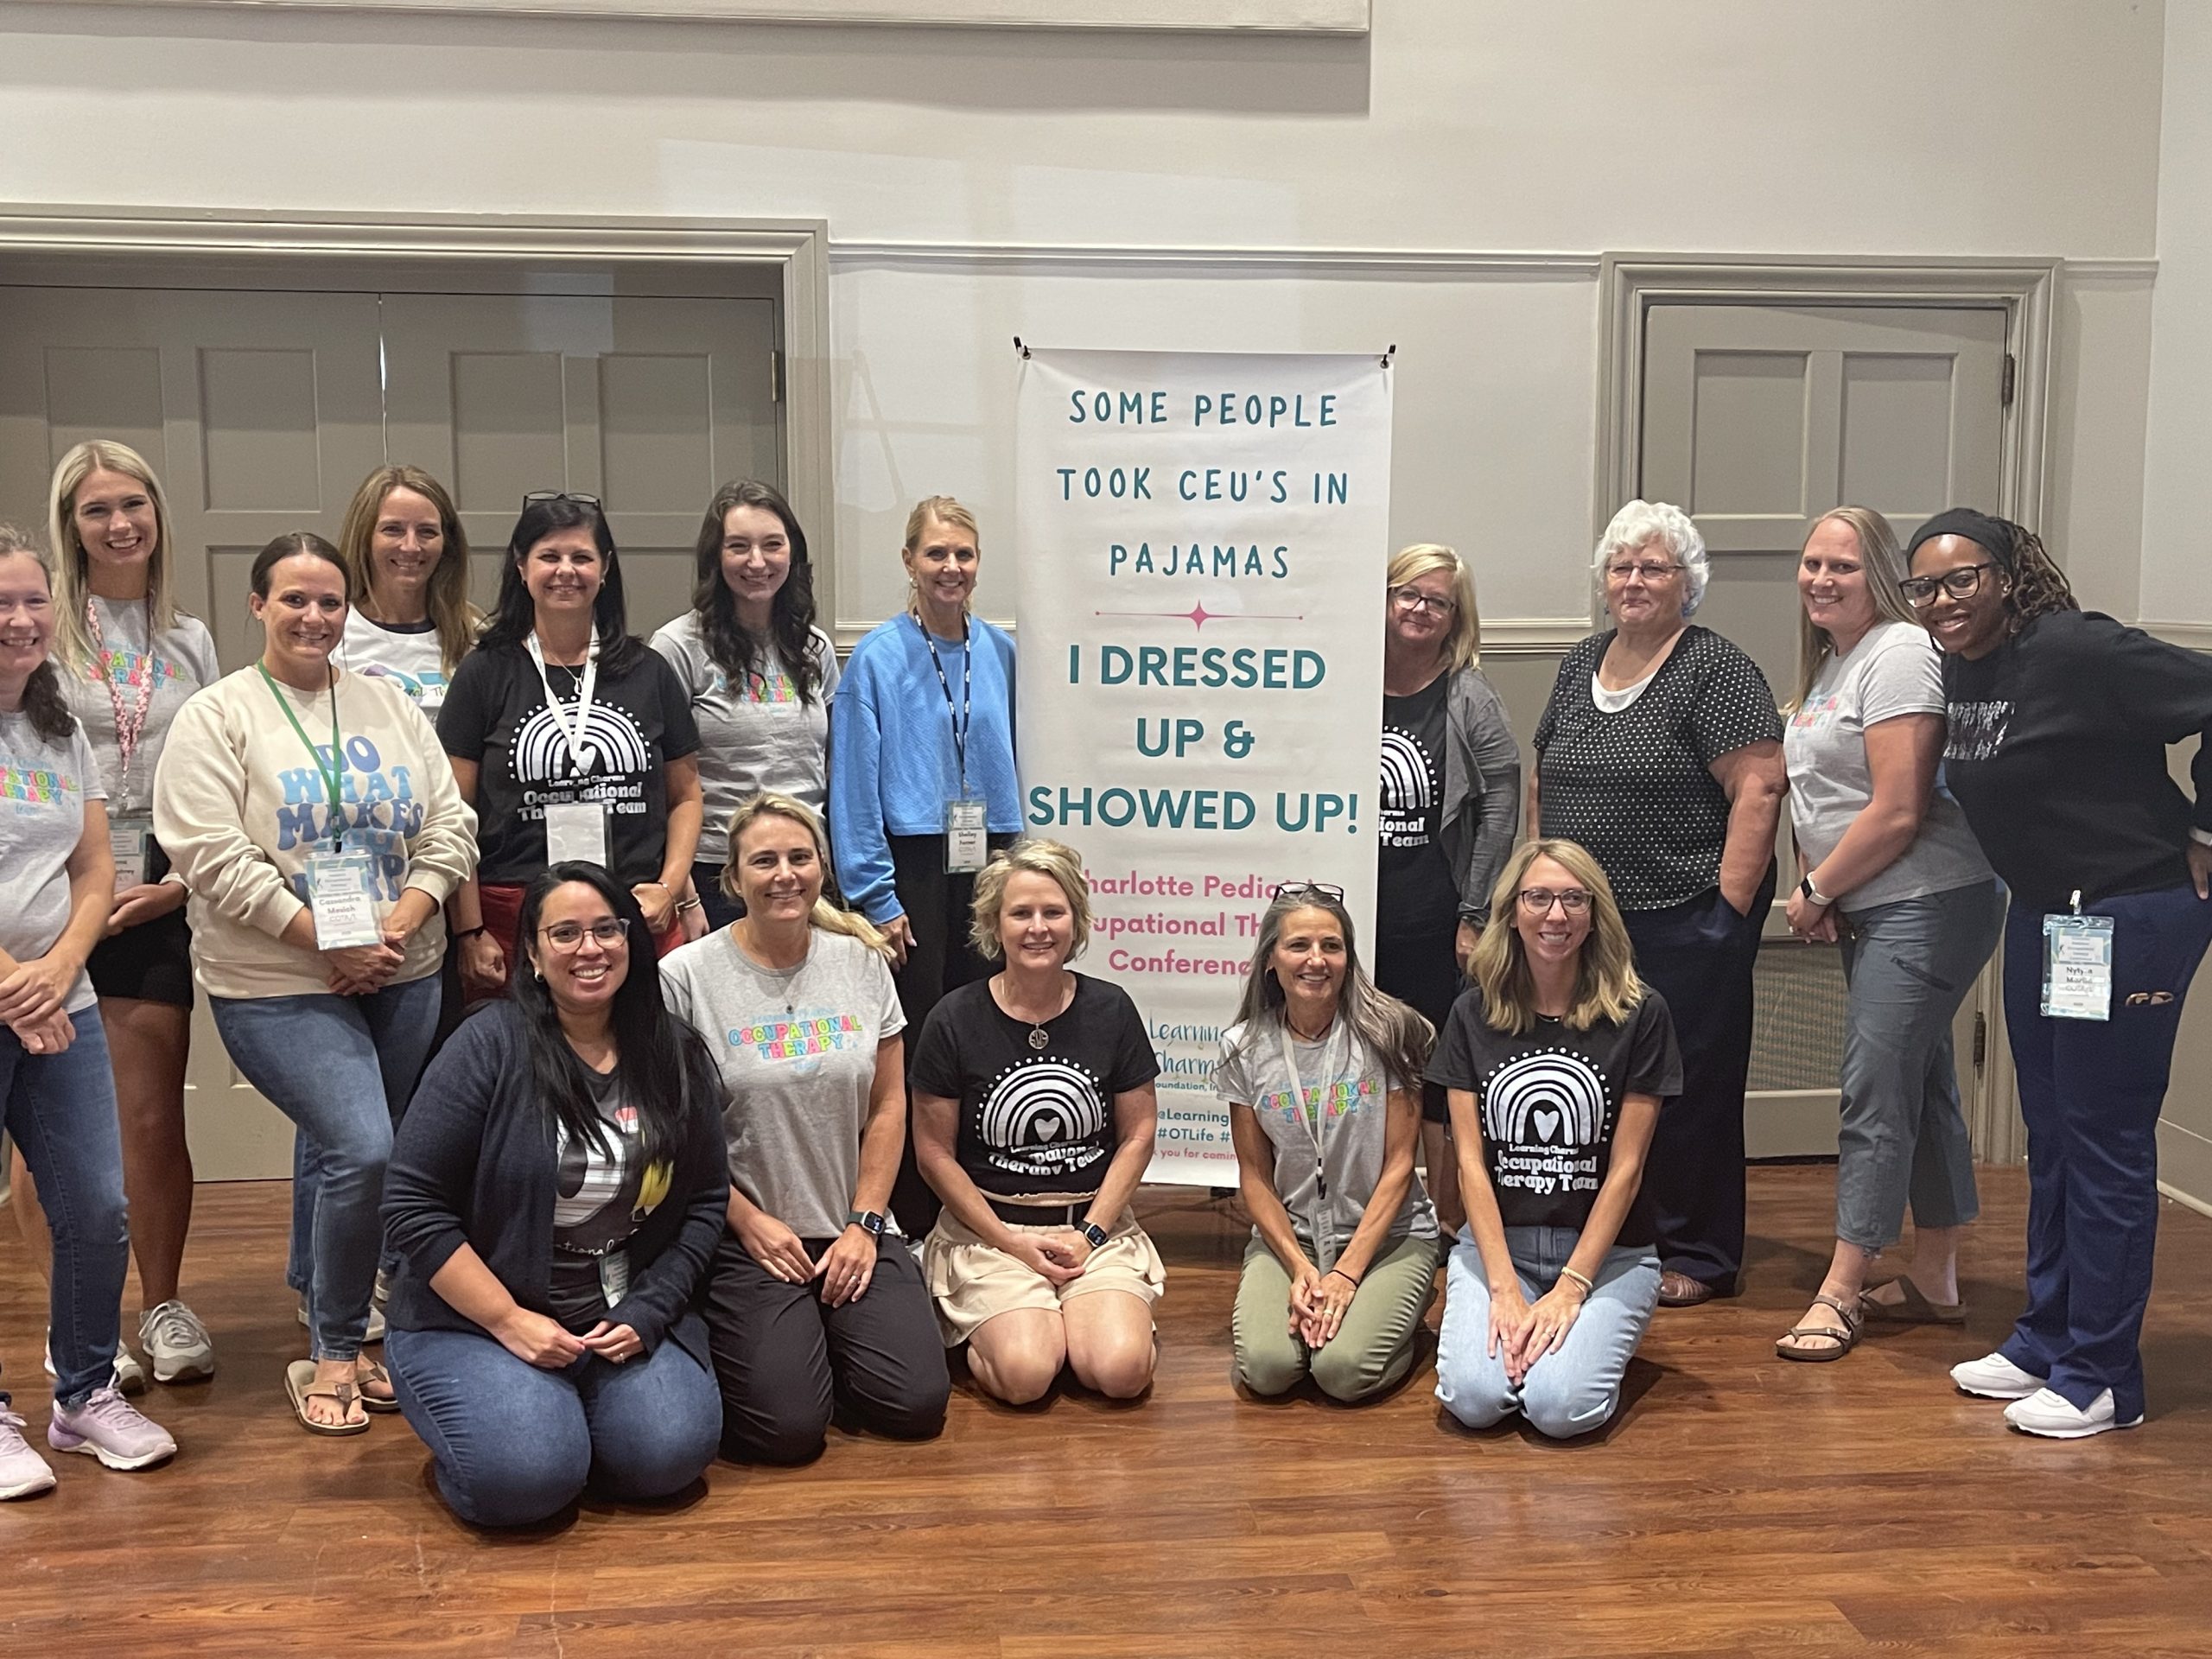
There are a brand new batch of 43 new O.T. Wizards that were trained at the Charlotte Pediatric OT Conference this past week! It was great to meet the OTA’s and OT’s that attended the training. In the first 1.25 hours , we discussed the struggles and pain points.
We had a 50/50 mix of OTA’s and OT/L’s with about 1/2 from clinics and the other 1/2 from either school systems or home health. I was able to show them how long this process has been in development.
I spent a good amount of time explaining and answering questions about our past (FUNdamental Foundations ) and current scoring philosophy, including Rasch analysis (and plans for the future!).
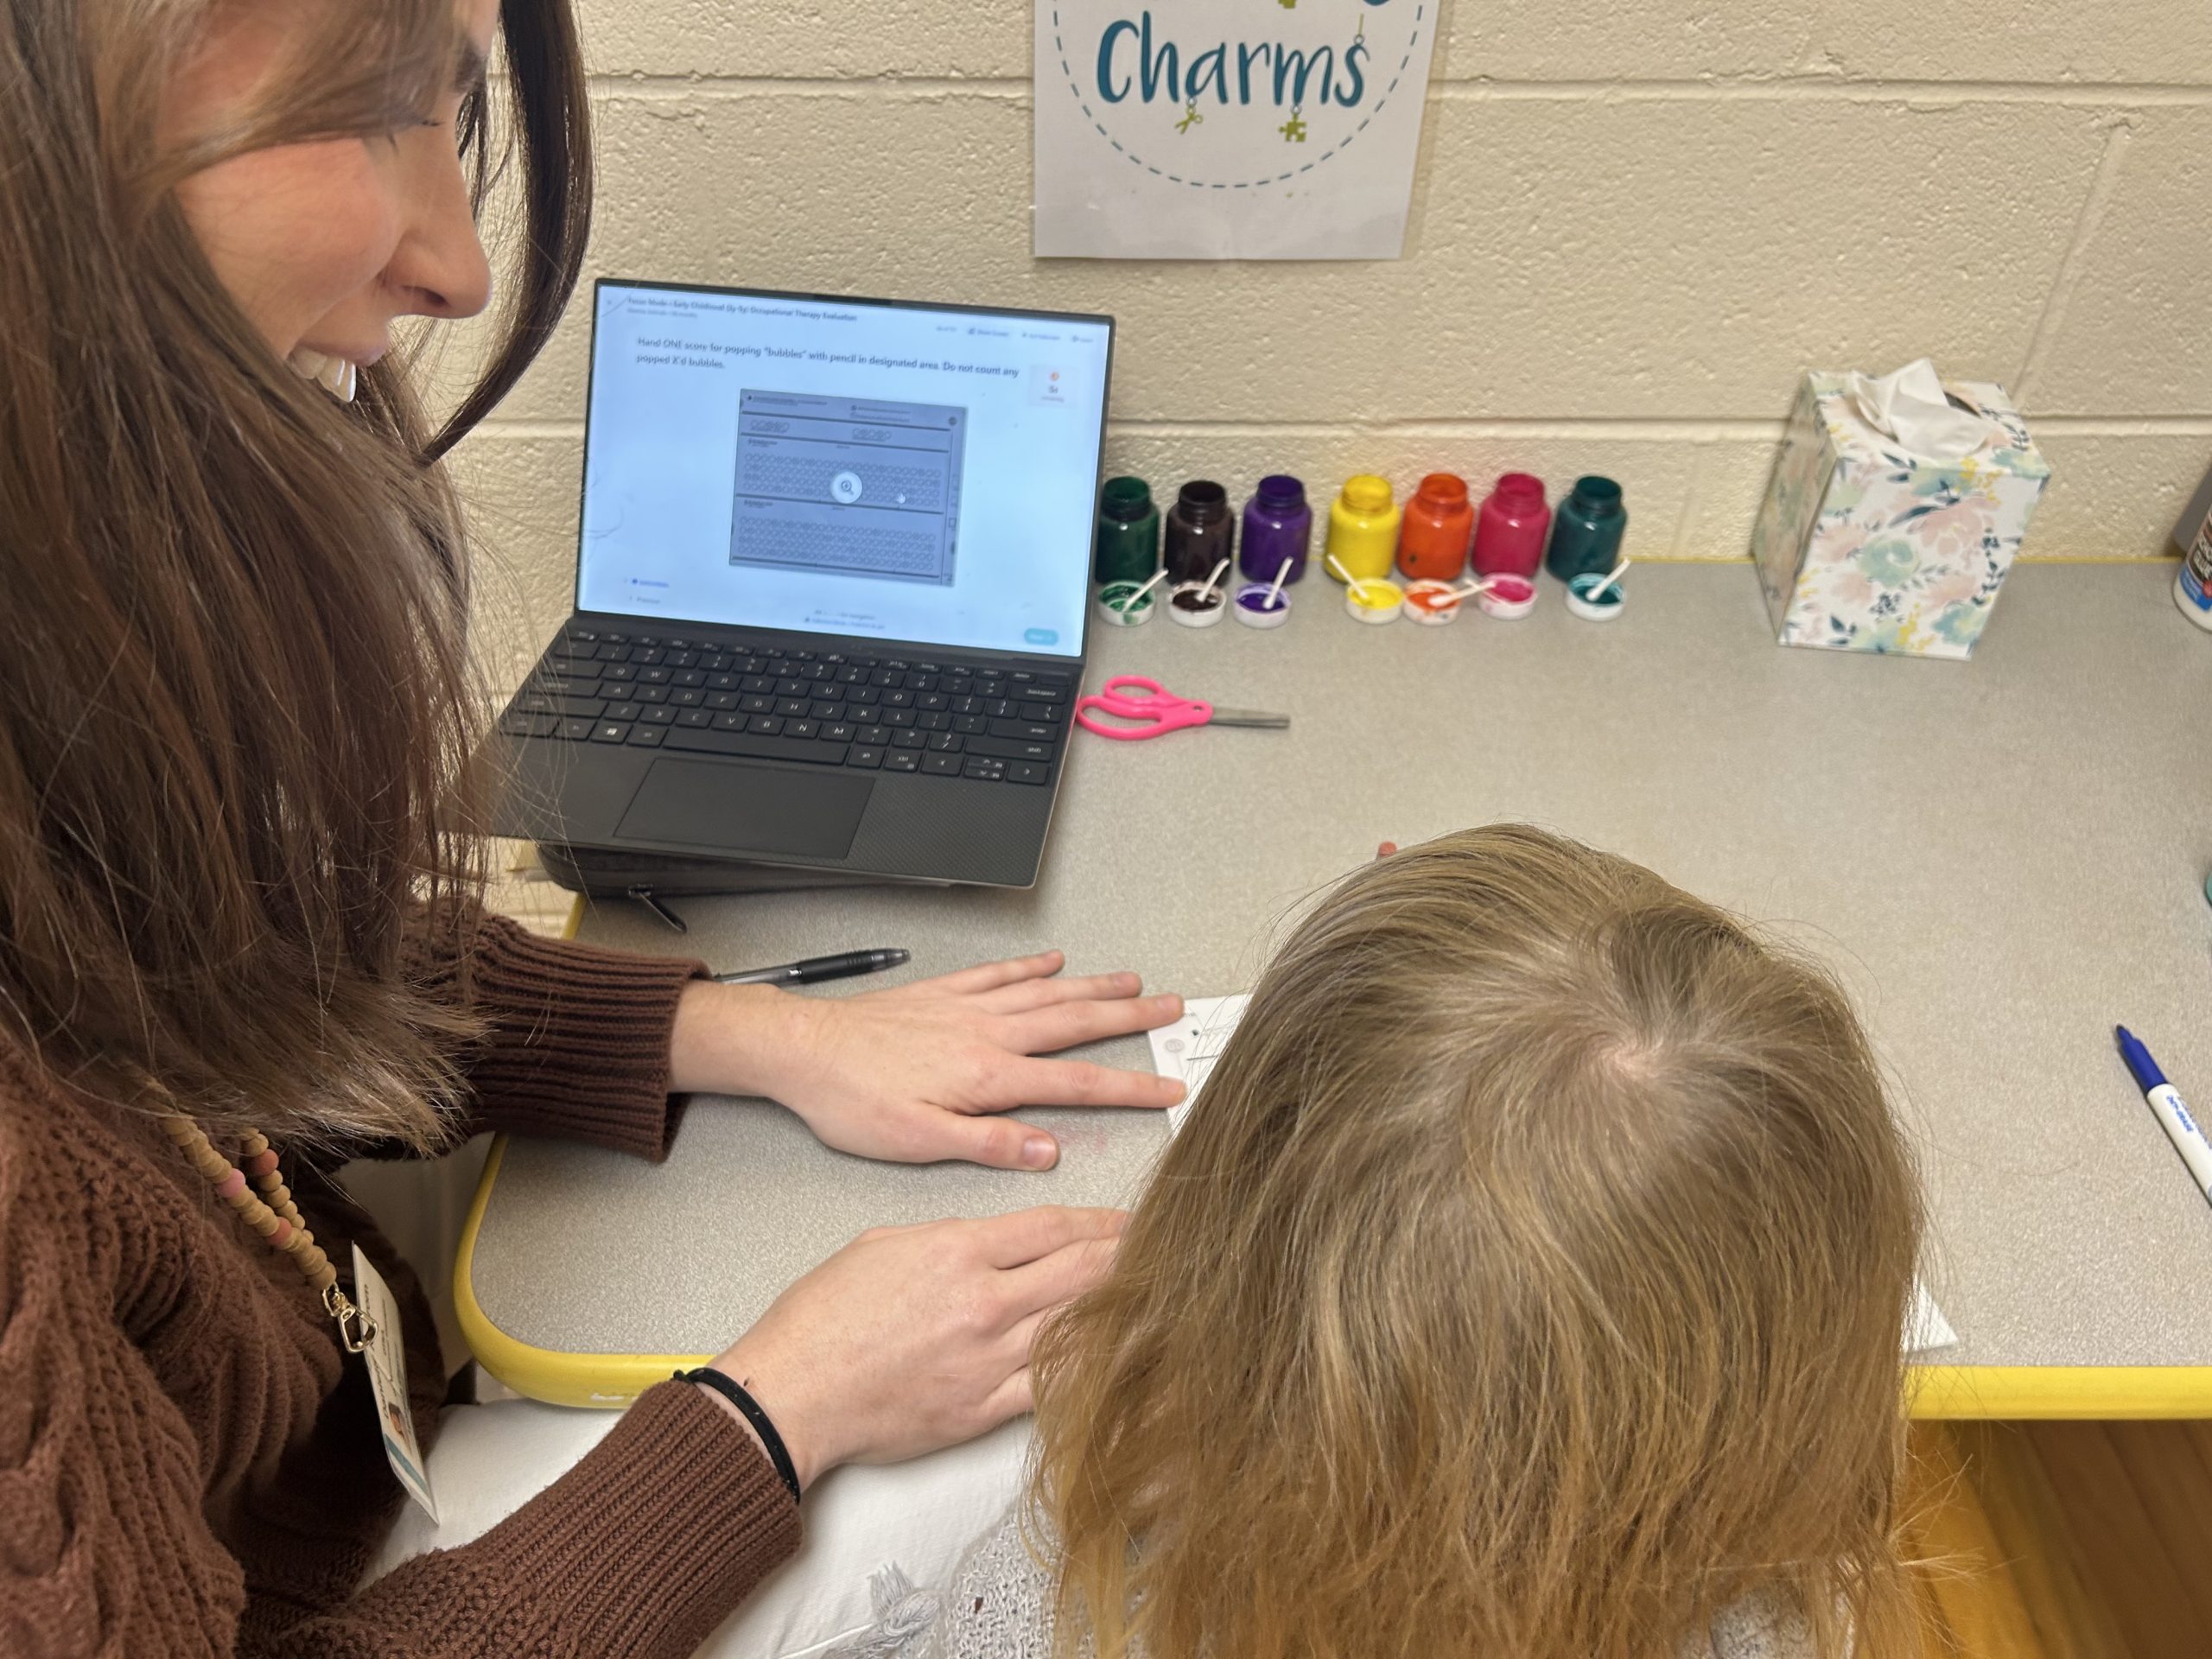
In the second part of the training, everyone created an account, added a “student” and then we created an evaluation together. I showed everyone how to administer some of the specialized assessments, including the WAND Preschool (pre-handwriting assessment), the Popping Bubbles (dexterity, speed and accuracy), and the scissor skills assessment.
After the evaluation , everyone created their instant report. I think they were pleasantly surprised! I received lots of notes about how excited they are to start using the OT Wizard.
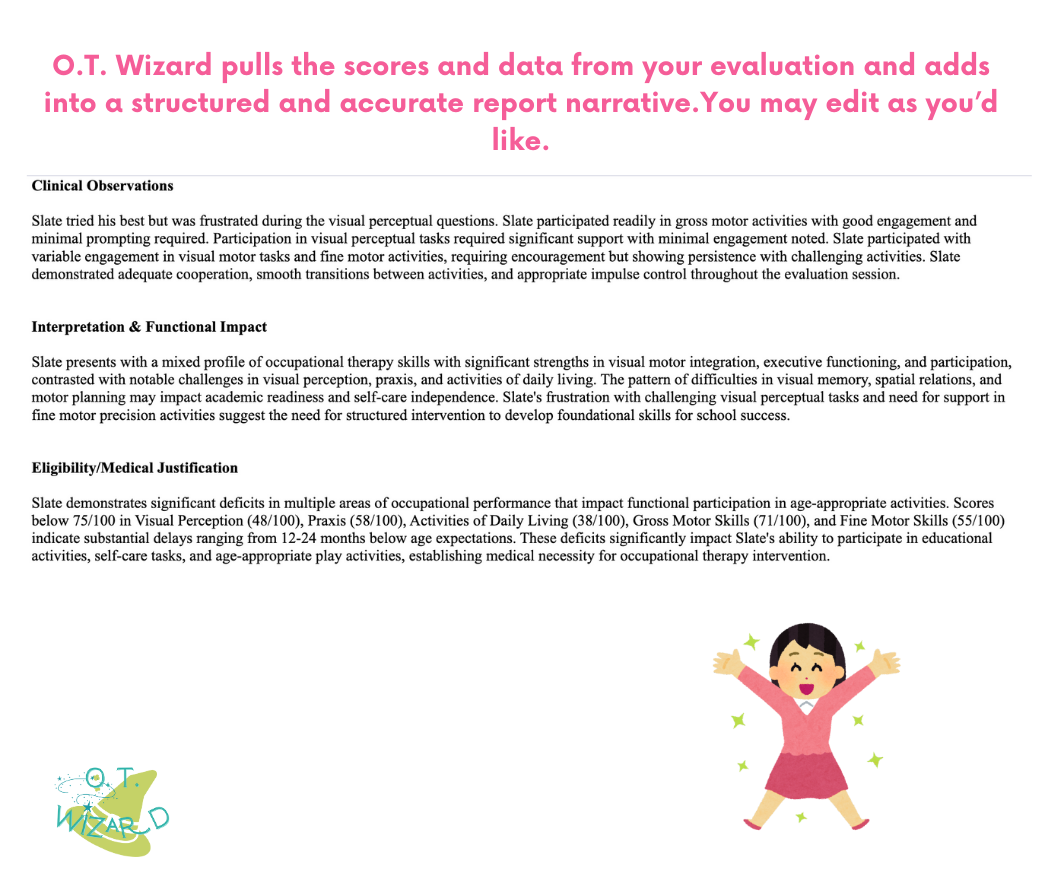
Ever wondered how O.T. Wizard transforms a 25-minute evaluation into a comprehensive, professional report? Let’s pull back the curtain on our auto-generation technology that’s saving therapists hours every day.
The Magic Behind the Wand
Our auto-report generation isn’t just about filling in blanks – it’s about creating meaningful, individualized narratives that accurately reflect each child’s unique abilities and needs.
Step 1: Smart Data Collection As you conduct your evaluation, the system intelligently captures:
Performance metrics against developmental milestones
Clinical observations in real-time
Standardized assessment scores
Qualitative notes and observations
Step 2: Algorithmic Analysis Our proprietary algorithm processes the collected data to:
Calculate domain and subdomain scores
Identify patterns and areas of concern
Compare performance to age-appropriate norms
Generate quantifiable metrics for progress tracking
Step 3: Narrative Construction Here’s where the real magic happens. The system:
Constructs grammatically correct, professional sentences
Adapts language based on your selected model (educational vs. medical)
Incorporates your clinical observations seamlessly
Creates PLOF and CLOF statements automatically
Suggests SMART goals based on student need areas
Recommends strategies based on student strengths and needs
Customization at Every Step
Edit any generated text to add your personal touch
Skip sections that aren’t relevant
Add custom observations and recommendations
Choose from multiple narrative styles
The Result? What traditionally took 1-3 hours now takes less than 10 minutes, without sacrificing quality or individualization. That’s time you can reinvest in direct therapy, professional development, or simply achieving better work-life balance.
We’re excited to announce significant updates to the O.T. Wizard platform, designed based on feedback from our community of over 50 therapists who’ve been using the system throughout our testing phase.
Each template now features smart language adjustment that automatically adapts based on whether you’re writing for educational (IEP) or medical model documentation.
Improved Scoring Algorithm Our proprietary algorithm now provides even more detailed insights:
Domain-specific scores with visual progress tracking
Subdomain analysis for targeted intervention planning
Total performance scores with age-appropriate milestone comparisons
New visual dashboard for at-a-glance caseload overview
Streamlined Workflow Enhancements
Skip any section functionality – unused sections automatically disappear from reports
Auto-population of previous evaluation data for re-evaluations
Faster navigation between client profiles
One-click report generation in under 10 minutes
Coming Soon
Multi- language administration (audio button to “speak” instructions to children)
Multi-language report options
Plan of care tracking system
Stay tuned for more updates as we continue to evolve the platform based on your valuable feedback!



 Best-Performing Domains
 Thank you for building the future of evidence-based OT assessment with O.T. Wizard.