A standardized worksheet with rows of small circles. Thirty seconds per hand. A sharpened pencil. That is the entire assessment.
We call it Fine Motor Speed and Accuracy Test (FMSAT)- because that is where we want the test taker’s attention. But the data is telling us the test is not really about speed at all. It is about which hand the nervous system has committed to, and when, and why some people never fully commit. After more than 1,400 bilateral trials across ages three to seventy-plus, the data is starting to show what this simple task can actually see.
Looking for a Fine Motor Screener
Pediatric and adult OTPs have long needed a brief, standardized, score-based measure that complements clinical observation without replacing it. We built the Fine Motor Speed and Accuracy Test (FMSAT) to fill that gap. But we wanted more than a number. We wanted evidence that the number maps onto the broader clinical picture a skilled clinician already sees.
The correlation picture emerging from our data is that kind of evidence. FMSAT scores are converging with the O.T. Wizard Fine Motor domain score, with related motor domains, and with the overall composite. They are converging with the Fine Motor Participation Rating Scale (FMPRS), our companion clinician observational instrument. And deliberately, we looked outside the O.T. Wizard platform for independent evidence, because self-referential data is not ecological validity.
One number stands out. Ninety-seven percent. That is the rate at which a child’s self-selected first hand on the FMSAT matches the clinician’s independent rating of their grasp hand, captured in the same session. For context, most concurrent validity correlations in pediatric motor assessment literature sit in the .40 to .60 range. A 97% agreement rate between a one-minute task-based score and an independent clinician observation is not ordinary.
O.T. Wizard
O.T. Wizard is a clinical intelligence platform for occupational therapy, built by a working clinician. It is not billing software with clinical documentation bolted on. The architecture runs the other direction. Evaluations produce structured scored data across clinical domains. Plans of care, goals, session measurement, and progress reports compose from that data. The FMSAT is embedded inside the evaluation workflow, which means every FMSAT score sits alongside clinician ratings captured in the same session, by the same clinician. That co-occurrence is what makes this dataset rare and the ecological validity analysis possible.
The FMSAT National Team
Assessment compliance is the quiet killer of norming studies. The FMSAT has mostly solved that problem by accident, because we designed it to be fast, and being fast made it feel like a game. One team member put it this way:
“I find this assessment really easy to administer and the students really like it. I’ve been telling them it’s a game we’re starting with to pop bubbles and they get really excited. One of my students was actually frustrated with me when he didn’t get to go first today LOL.”
The lifespan data is being built by a distributed team of licensed OTPs from school-based and clinic-based settings. Some of our most active therapist researchers to date are: Lauren David, Veronica Sydlowski, Kelly Simiele, Christie LeClair, Meghan Taylor, Jenna Hogan, Kayla Hauck, Chanda Waller, Ronda Horton, Catherine Jones, Meredith Pait, and the full Learning Charms therapy team. The project is IRB-determined as not-human-subjects research (Pearl IRB 2026-0154). A sixty-second administration produces meaningful data on both hands, where Hand One is the test taker’s self-selected first hand and Hand Two is the other.
Combined Lifespan Trends
A developmental trajectory is emerging from the combined data. The gap between Hand One and Hand Two rises through early childhood, peaks in young adulthood, and compresses again in adults sixty and older. One of the patterns that surprised us most is how far that compression goes. In our current data, the Hand One to Hand Two gap in adults in their sixties looks more like the gap in a six-year-old than in a forty-year-old. A one-minute screener appears to be catching the full arc of neuromotor lateralization across the lifespan.
There is a plausible framework for part of this pattern. The HAROLD effect, or Hemispheric Asymmetry Reduction in Older Adults, was first described by Cabeza (2002) and has since been documented in motor performance by Seidler et al. (2010) and Sullivan et al. (2010). The pattern we are seeing in adults sixty and older is consistent with what HAROLD predicts: reduced hemispheric specialization as the brain ages, which would show up on a bilateral motor task as a compressed gap between hands. Our data is early and the sample in this age range is still small. We are not in a position to claim HAROLD replication. We are in a position to say the trend line in our data is pointing where the literature would predict it should point, and we intend to keep collecting.
What It May Be Measuring
The test directs attention toward speed and accuracy. The constructs surfacing in the data are different. Fine motor capability, reflected in the Hand One score. Neuromotor lateralization, reflected in the gap between the two hands. These are separate clinical questions and should not be collapsed into a single number. The X-score, which counts errors on distractor circles the test taker is instructed to skip, appears to capture a third construct entirely: impulse control. That will be its own study.
The Finding That Is Changing How We Build Norms
Left-dominant test takers show about half the asymmetry of right-dominant test takers. We think a lifetime of adapting to right-biased tools, scissors, can openers, computer mice, spiral notebooks, trains the non-dominant hand upward. Whatever the cause, it means the norms we build cannot treat everyone the same way. More to come on that front.
Join the Team
The dataset now spans ages three through seventy-plus, and collection continues. We are specifically seeking OTPs with access to adult populations to join the National Team. We plan to finish the research by mid summer 2026. Contributors are acknowledged by name in the validation work and earn CEUs through the O.T. Wizard platform. If you are interested, reach out: stephanie@learningcharms.com.
If you work with children, you already know that fine motor development is not a single skill. It is a constellation of abilities that unfolds over years, shaped by neurology, practice, environment, and opportunity. What is harder to capture in a clinical setting is the relationship between the two hands, specifically how the dominant and non-dominant hand diverge as laterality develops, and what that divergence tells us about where a child is in their developmental trajectory.
That is exactly what we set out to examine with the FMSAT, the Fine Motor Speed and Accuracy Test. We are currently in the norming phase of the project, collecting data across age groups, classification types, and settings to build a representative dataset. We do not yet have enough responses to publish normative scores, but the early trends are worth discussing because they are clinically interesting and because they reinforce concepts that developmental science has long described but that practicing clinicians rarely have a quick tool to measure.
A Quick Overview of the Task
The FMSAT uses a standardized worksheet placed over a piece of craft foam. The test taker uses a sharpened pencil to puncture a hole in each circle on the worksheet, working through the task one hand at a time. Each hand is timed to 30 seconds. The test taker self-selects which hand to use first, which in most cases is the dominant or preferred hand, and then completes the same task with the opposite hand. This produces two independent scores per session, one for each hand, along with observational data about task comprehension and strategy use.
The Laterality Arc Is Showing Up in the Data
One of the most consistent early findings is that younger children score more similarly across both hands, while older children show a progressively larger gap between dominant and non-dominant hand performance. That gap appears to widen through the elementary school years and then stabilize in adulthood.
This is consistent with what developmental theory tells us about laterality. Hand preference is not fully established in most children until somewhere between ages four and six, and functional dominance, meaning the degree to which the dominant hand has pulled ahead in skill, continues to develop well into middle childhood. What the FMSAT appears to be capturing is the functional expression of that process. The two hands are not just different in preference. They become increasingly different in capability as the dominant hand accumulates practiced, automated movement patterns through activities like writing, drawing, and tool use that the non-dominant hand simply does not experience in the same way.
The clinical implication is significant. A large gap between the two hands in a seven or eight year old may reflect healthy lateralization. The same pattern in a ten year old whose non-dominant hand is barely functional as a stabilizer is worth examining more closely. And a very small gap in a six year old may not reflect strong bilateral skills. It may reflect that neither hand has yet established the motor memory that comes with consistent, repeated use of one hand over the other.
Both Hands Are Affected in Children Receiving Services
Children in our dataset who are receiving or have been referred for occupational therapy, physical therapy, speech, or special education services are scoring lower on both hands compared to peers in general education. Not just the non-dominant hand. Both hands.
This finding challenges a framing that sometimes creeps into documentation and goal writing, the idea that a child’s dominant hand is functional and the non-dominant hand is the problem. In our early data, the fine motor challenge appears to be more global. The non-dominant hand is not functioning effectively as a stabilizer or assist hand, which has downstream effects on every two-handed task a child encounters throughout their day. Scissor use, keyboard tasks, object manipulation, self-care, and play all require some degree of coordinated bilateral input. When both hands are underperforming, the functional impact extends well beyond what a handwriting goal alone will address.
Gender Is Not Driving the Scores
Our early data shows almost no difference between male and female performance on the first hand portion of the assessment, less than one tenth of a point difference in mean scores across the full sample. This is worth noting because many fine motor assessments show higher scores for girls, often attributed to earlier neurological maturation, play preferences that favor fine motor practice, or behavioral compliance during structured testing.
The FMSAT’s format may be minimizing some of those influences by presenting a novel, motivating task that does not favor previously practiced skills in the same way that pencil and paper writing tasks do. If the gender parity in our data holds as the sample grows, it would support the use of a single normative table for both sexes and strengthen the argument that the assessment is measuring motor capacity rather than motor experience.
What We Hope This Tool Becomes
The FMSAT was designed to fill a gap that many clinicians feel but struggle to articulate in documentation, the need for a quick, standardized measure of laterality and bilateral fine motor asymmetry that produces defensible, reportable scores. As the dataset grows, we hope to examine whether FMSAT performance correlates with participation in the occupations that matter most to the children we serve, including keeping up with classroom demands, managing self-care and chores at home, and engaging in the play and peer interactions that require confident, coordinated use of both hands.
We are also exploring the potential for the FMSAT to serve as a screener within Multi-Tiered Systems of Support frameworks. A brief validated tool that can flag students who may benefit from Tier 2 or Tier 3 fine motor support before a full evaluation is warranted addresses a real gap in how schools identify children with emerging concerns. Paired with a comprehensive evaluation, it could also serve as a progress monitoring tool, giving clinicians a repeatable, objective measure of whether the gap between the two hands is narrowing over time in response to intervention.
None of this is possible without data. If you are an occupational therapist, COTA, who works with children or adults ages three and up, we invite you to contribute to the norming project. The age bands we need most urgently are the youngest, children ages three through five, where fine motor skill is changing rapidly and even a few months difference in age can reflect meaningfully different developmental profiles. Every submission strengthens the foundation we are building, and the tool we are building is for every child who deserves to have their fine motor profile understood with precision and reported with confidence.
How 3.8 Years of Systematic Clinical Measurement Demonstrates That Occupational Therapy Works
Stephanie Seymore Wick, MSOT, OT/L | Founder and Clinical Architect, O.T. Wizard | Learning Charms, Inc., Charlotte, North Carolina
The Problem With Checklists
For years, occupational therapists working in early childhood settings were collecting data that told them almost nothing. Checklist-style evaluations produced a snapshot: present or absent, yes or no. They could not tell you whether a child improved. They could not tell you which counties had greater concentrations of developmental need. They could not tell you whether your team’s intervention was moving the needle or whether children were simply getting older.
That was the reality facing Learning Charms in 2022. We were screening and evaluating large numbers of children across Head Start programs, NC Pre-K classrooms, and community settings throughout North Carolina, and we had nothing meaningful to show for it in terms of trend data, geographic insight, or outcome evidence.
So I built something.
From Nothing to 8,509 Screenings and Evaluations
The FUNdamental Foundations (FF) screener was designed and developed by a managing pediatric occupational therapist with 25+years of clinical experience. It was built as a structured, multi-domain developmental tool designed from the outset to generate analyzable data. It was not designed for publication. It was designed to answer clinical questions: What does this population look like? Where are the gaps? Is what we are doing making a difference?
Thirty clinicians on the Learning Charms team tested and used each version in the field, providing the real-world feedback that drove every refinement. They made the transition from paper-and-pencil evaluations to digital data entry on a tablet or laptop, mid-session, with children in front of them. That is not a small ask. The early weeks required support with the technology. There were growing pains. The team did it anyway, and they did it without much, if any complaint.
The FF tool went through two versions, each refined based on team feedback. Version 6 ran from June 2022 through July 2023. Version 7, with improvements including date of birth capture and an updated item structure, ran from August 2023 through May 2025. In late 2025, the practice transitioned to O.T. Wizard, a fully rebuilt clinical intelligence platform designed and built by the same therapist. O.T. Wizard was built with Rasch psychometric architecture, 15 guided evaluations, and integrated outcome tracking across 12 domains.
The table below summarizes what 3.8 years of that effort produced.
Table 1. Clinical Data Collected Across the Full Evidence Ecosystem (2022-2026)
Platform
Period
Records
Evaluations
Screenings
E1-E2 Pairs
FUNdamental Foundations V6
Jun 2022 – Jul 2023
2,928
1,511
1,417
324
FUNdamental Foundations V7
Aug 2023 – May 2025
4,962
2,368
2,594
477
O.T. Wizard
Sep 2025 – Mar 2026
619
619
—
97
TOTAL
3.8 years
8,509
4,498
4,011
898
Note. E1-E2 pairs = children with two complete evaluations allowing pre-to-post comparison. FF V6 pairs are V6-only matches. FF V7 pairs include V7-only and cross-version (V6 E1 to V7 E2) matches. OTW pairs matched by Student_ID. pp = percentage points.
In total: 8,509 individual assessment records. 4,498 full evaluations. 4,011 developmental screenings. 898 pre-to-post evaluation pairs. Over 245,000 item-level data points. Collected by a single clinical team, through routine practice, over less than four years.
What the Data Shows: Gains That Exceed Maturation
The central question in any clinical outcome dataset without a randomized control group is this: how do you know the gains are from intervention and not just from children getting older?
We address this directly.
Using cross-sectional developmental data from our own E1 (Initial Evaluation) dataset, we calculated the expected rate of developmental growth per month for each skill area based on age alone. This gives us a maturation baseline specific to this population. We then compared that expected gain to the gains actually observed in children who received OT services between E1 and E2 (Re-evaluation), over a mean interval of 5.4 months.
The results are consistent across all three measured domains and across both independent datasets.
Table 2. Observed Gains vs. Expected Maturation Over Mean 5.4-Month Interval (FF n=801 pairs, OTW n=94 pairs)
Item
FF Observed Gain
Expected (Maturation)
Ratio
OTW Observed Gain
Draw a Person (0-4 scale)
+1.24 pts
+0.39 pts
3.2x
+1.06 pts
Functional Pencil Grasp
+25.3 pp
+9.7 pp
2.6x
+27.7 pp
Finger Touching (54-mo milestone)
+20.3 pp
+11.7 pp
1.7x
n/a
Cohen’s d (DAP)
0.94
—
—
0.84
Note. Expected gain calculated from cross-sectional linear regression of E1 scores on age in months using the full FF evaluated dataset. pp = percentage points. Cohen’s d: 0.2 = small, 0.5 = medium, 0.8 = large effect. OTW finger touching item not directly comparable due to different item structure.
Draw a Person improved at 3.2 times the expected developmental rate in FF and 2.6 times in OTW. Functional pencil grasp improved at 2.6 times expected in FF and 3.1 times in OTW. These are not marginal differences from what maturation alone would predict. They are two to three times larger. And they replicate across an entirely independent dataset collected with a different tool, by the same team, with different children.
Why This Is Not Just Children Getting Older
If the gains above were driven primarily by maturation, we would expect children at all starting points to show similar improvement. A child who enters at score 0 would gain roughly as much as a child who enters at score 3, because age-related development does not care where you start.
That is not what we see. The table below shows Draw a Person gains stratified by E1(Initial Evaluation) score, combining FF and O.T. Wizard data. The pattern is unambiguous.
Table 3. Draw a Person Gain by E1 Score: FF (n=801) + OTW (n=93) Combined
E1 Score
n
E2 Mean
Mean Gain
% Improved
% Same
% Declined
0 (no parts)
365+29
1.74
+1.74
74%
26%
0%
1 (approximations)
203+16
2.37
+1.37
81%
13%
6%
2 (head, no body)
165+31
2.66
+0.66
54%
37%
9%
3 (recognizable)
60+11
2.96
-0.04
29%
46%
25%
4 (6+ body parts)
8+6
3.36
-0.36
0%
57%
43%
Note. n column shows FF count + OTW count at each E1 score level. E1 score 0 = no recognizable approximations. Score 4 = recognizable person with 6 or more body parts. Gains decline systematically as E1 score increases, reflecting ceiling effects at higher starting points rather than absence of progress.
Children who started at score 0 improved by an average of 1.74 points, with 74% showing measurable gains. Children who started at score 3 or 4 were near the ceiling of the scale and showed flat or slightly negative scores at E2, exactly as ceiling effects predict.
This score-dependent gain gradient is the signature of a real treatment effect. Maturation produces relatively uniform gains regardless of starting point. Intervention produces the largest gains in children with the most room to grow. That is what we observe, and it replicates point-for-point across both the FF and OTW datasets independently.
The grasp and finger touching data tell the same story from a different angle.
Table 4. Skill Transition Rates: What Happened Between E1 and E2
Item
Status at E1
n
Outcome at E2
Pencil Grasp
Non-functional
377 (FF) + 65 (OTW)
60% converted to functional
Pencil Grasp
Functional
417 (FF) + 29 (OTW)
94% maintained functional
Finger Touching
Fail
407 (FF)
58% passed at E2
Finger Touching
Pass
394 (FF)
82% maintained pass
60% of children with non-functional pencil grasp at E1 had functional grasp by E2. 94% of children with functional grasp at E1 maintained it. Skills were not fluctuating randomly. They were moving in one direction and holding. That is not maturation. That is intervention.
Two Tools, Three Years Apart, Same Answer
The FF screener and O.T. Wizard are different instruments. FF was a clinician-developed Google Form with embedded scoring anchors and standardized stimulus materials. O.T. Wizard is a fully architected clinical platform undergoing Rasch psychometric validation, with 596 data variables per evaluation and item-level calibration. The two tools share several core items, including Draw a Person, pencil grasp classification, and finger touching. They do not share overlapping children. The DAP scale is directly comparable across both tools at the 0 to 4 range, with identical scoring anchors at each level. O.T. Wizard extended the ceiling by adding two higher-level descriptors, bringing the OTW scale to 6 points total. For this analysis, OTW DAP scores were capped at 4 to ensure a valid cross-tool comparison.
Yet when we calculate the cross-sectional developmental growth rate for Draw a Person from FF E1 data, we get 0.072 points per month. From OTW E1 data, we get 0.082 points per month. Two tools, thousands of children, the same underlying developmental trajectory captured within 0.01 points of each other per month.
When two independent measurement systems produce convergent developmental slopes and convergent gain ratios, that is not a coincidence. That is construct validity. Each dataset serves as an independent replication of the other’s findings, and both point to the same conclusion.
Danielle, an OTR/L out of NC, administers an evaluation with a 3 year old using OT Wizard
What This Means for OT Practice and Clinical Infrastructure
Pediatric occupational therapists have long known that their interventions make a difference. The challenge has been demonstrating it systematically, at scale, in a form that partners, funders, schools, and insurance providers find credible.
The Learning Charms team built that demonstration over 3.8 years, starting from scratch, with no research funding, no university partnership, and no IRB. They built it by replacing meaningless checklists with structured clinical measurement, by training a team of 30 clinicians to collect data consistently, and by iterating their tools until the data was worth analyzing.
O.T. Wizard is the current iteration of that infrastructure. It is not a platform claiming efficacy. It is a platform whose evidence base already exists, built by the same team that built the platform, using the same children, in the same communities, over the same years. The data in this paper is not a promise of what O.T. Wizard will eventually show. It is a record of what systematic clinical measurement has already demonstrated.
OT works. The data, replicated across tools and years and nearly 900 pairs of children, shows it.
Disclosure
Stephanie Seymore Wick is the founder and clinical architect of O.T. Wizard and owner of Learning Charms, Inc. All data was collected through routine clinical practice and contracted screening partnerships. No external funding was received. The FUNdamental Foundations screener was a clinician-developed field tool and has not undergone formal psychometric validation. O.T. Wizard is currently undergoing Rasch analysis validation. All findings should be interpreted as practice-based clinical evidence rather than results from a randomized controlled trial.
About O.T. Wizard
O.T. Wizard is a clinical intelligence system for pediatric occupational therapy professionals. The platform supports evaluation, documentation, goal planning, and scheduling across 12 domains including fine motor skills, visual-motor integration, praxis, visual perception, executive functioning, activities of daily living, and participation. O.T. Wizard is undergoing Rasch analysis validation to establish psychometrically sound, norm-referenced scoring with living norms that update as the clinical database expands. Learn more at otwizard.com.
About Learning Charms
Learning Charms is a pediatric occupational therapy group that employs roughly 25 OTP’s in the Charlotte , NC and surrounding counties. Learning Charms is now focused mainly on preschool aged children in their school environment.
89% Improved. Five Domains Exceeded Natural Growth. Here Is What the Data Shows.
Measuring Pediatric OT Outcomes Above the Threshold of Natural Maturation
By Stephanie Seymore Wick, MSOT, OT/L | Founder and Clinical Architect, O.T. Wizard
Introduction
Every pediatric occupational therapist knows that the work they do matters. The harder question is whether the profession can show, in precise and reproducible terms, how much it matters. For decades, OT documentation has been built around goals, progress notes, and clinical narratives. These tools record care. They rarely measure change in a way that separates what the child gained through intervention from what developmental maturation would have produced on its own.
This report addresses that gap directly. Using O.T. Wizard, a clinical intelligence system designed to generate structured, reproducible, multi-domain assessment data for pediatric OT practice, we examined functional performance change across eight domains in 71 preschool-aged children who completed two full evaluations an average of 4.85 months apart.
The central question throughout this analysis is not simply whether children improved. The meaningful question is whether the children in this cohort improved beyond what developmental maturation alone would have produced over the same interval. A natural growth correction applied consistently throughout this report makes that distinction explicit in every finding.
This is the expanded replication of a February 2026 analysis of 44 paired evaluations. The findings across the 27 additional pairs are consistent with and strengthen the earlier report across all domains. The core story does not change with more data. It becomes more precise.
ABSTRACT
Background: Pediatric occupational therapy has well-established standardized tools for point-in-time measurement, including the Bruininks-Oseretsky Test of Motor Proficiency, Beery-Buktenica Developmental Test of Visual-Motor Integration, and Peabody Developmental Motor Scales-Third Edition. Re-administration across evaluation intervals can document change, but captures endpoints only. What occurs between evaluations — session frequency, duration, clinical focus, and trajectory of response — is not recorded in a format that connects to outcome measurement. Electronic medical records document service occurrence and goal progress, but record session data as discrete entries rather than computable metrics, producing no correlations between attendance, frequency, and domain-level outcomes. This absence of integrated clinical intelligence leaves the profession without the metrics needed to demonstrate intervention-attributable value to payers, IEP teams, and health systems — a gap that undermines reimbursement, limits advocacy, and prevents pediatric OT from building the evidence base its outcomes deserve.
Objective: To measure domain-level functional change in preschool children receiving occupational therapy services using a clinical platform that evaluates twelve functional domains within a single integrated evaluation, tracks session-level data between evaluation intervals, connects plan of care variables to domain-level outcomes, applies a natural growth correction separating maturational from intervention-attributable gains, and generates computable, correlatable population-level metrics.
Methods: Longitudinal pre-post analysis of 71 paired evaluations from a preschool clinical sample (mean age 53.5 months; mean interval 4.85 months; at least 90% Medicaid-qualifying). A 9.2% natural growth rate was applied as the maturational baseline. Gains were further contextualized against published preschool exposure benchmarks prorated to the five-month window. All data are pre-Rasch ordinal values.
Results: 89% of children improved in under five months. Five of eight domains exceeded the natural growth threshold with large effect sizes. VMI exceeded the published preschool exposure benchmark by d=0.92, ADL by d=0.90, and Fine Motor by d=0.65. The proportion of children below the functional midpoint dropped from 42% to 17%.
Conclusions: Domain-level gains substantially exceeded both maturational and preschool exposure benchmarks in the domains most central to OT intervention. Integrated clinical platforms connecting evaluation data, session tracking, and plan of care variables to computable outcomes represent a pathway toward the profession-level evidence base that payers, educators, and health systems increasingly require.
Study Sample
Age Distribution
The longitudinal cohort consisted of 71 preschool-aged children, each with two complete O.T. Wizard evaluations separated by a minimum of 30 days. The mean inter-evaluation interval was 4.85 months (approximately 148 days), with a range of approximately 37 to 173 days. Mean age at first evaluation was 53.5 months.
Starting age band distribution: Band G (36 to 47.99 months, n=6), Band H (48 to 53.99 months, n=29), Band I (54 to 59.99 months, n=33), and Band J (60 to 65.99 months, n=3). Bands H and I together represent 87% of the sample and are the primary basis for findings reported here. Bands G and J are included in the data but interpreted with caution given their smaller sizes.
Demographics and Clinical Status
All assessments were conducted in North Carolina through the O.T. Wizard clinical platform. Consistent with the broader software dataset, at least 90% of children qualified for Medicaid, and for many, the structured evaluation environment represented an early introduction to formal educational or clinical settings. Primary language was English for 90% of children, with 9% Spanish-speaking and 1% other. All children had been recommended for occupational therapy services following developmental screening failure.
It is important for readers to interpret these findings within this clinical context. This is not a typically developing population. These are children with identified developmental concerns who were referred for and receiving skilled OT services. Outcome findings therefore reflect the response of a clinically referred, predominantly low-income sample to structured early intervention, not population-level developmental norms.
Natural Growth Framework
Before examining domain-level findings, it is necessary to establish what score change we would expect to observe in the absence of intervention. Children in this cohort averaged 53.5 months of age at first evaluation and were reassessed approximately 4.85 months later. On a well-constructed developmental scale, maturation alone would be expected to produce a gain proportional to that age progression.
The natural growth rate for this cohort is calculated as the mean inter-evaluation interval divided by the mean age at Evaluation 1: 4.85 months divided by 53.5 months equals 9.2%. This figure represents the expected score improvement attributable to developmental maturation alone over the study period.
A gain of 9.2% would be expected from natural maturation alone over 4.85 months.Gains above 9.2% represent intervention-attributable change.
This natural growth rate serves as the reference threshold throughout this report. Domain gains below 9.2% suggest performance did not keep pace with chronological age progression. Gains at 9.2% suggest maturation-equivalent growth. Gains above 9.2% represent functional improvement beyond what age progression alone would predict.
This correction is transparent, reproducible, and requires no external normative sample to apply. It is a direct arithmetic relationship between age progression and scale progression on a fixed instrument. The Gain Above Natural column in each table makes this comparison explicit.
Research Hypotheses
Three primary hypotheses guided this analysis. First, children receiving occupational therapy services would demonstrate composite score gains substantially exceeding the 9.2% natural growth threshold. Second, domains most directly targeted by OT in preschool settings, specifically visual motor integration, fine motor skills, visual perception, and activities of daily living, would show the largest gains above expected growth. Third, Band H children (48 to 53.99 months) would demonstrate greater gains than Band I children, reflecting greater developmental sensitivity at a younger starting point.
Literature Review and Context
The preschool years represent a critical period for fine motor and visual motor development. Between the ages of three and five, neuromotor pathways underlying pencil control, bilateral coordination, and hand specialization undergo rapid maturation, establishing the foundation for academic skill development. Handwriting readiness, scissor use, and self-care independence all draw from skill sets that are most efficiently built during this developmental window.
Visual motor integration has consistently been identified as one of the strongest predictors of kindergarten handwriting readiness. Daly and colleagues (2003) found VMI performance at preschool age predicted handwriting speed and legibility at ages six and seven with effect sizes exceeding those of fine motor or visual perception measures alone. Duff and colleagues (2015) demonstrated that children with developmental coordination difficulties who receive targeted fine motor intervention during the preschool years show significantly better handwriting outcomes at school entry than matched peers without services. It is equally important to recognize that VMI does not operate in isolation as a predictor of handwriting development. Emergent literacy skills, particularly alphabet knowledge, letter-sound awareness, and early orthographic processing, are also well-established predictors of handwriting fluency and transcription accuracy (Gerde et al., 2025; Puranik et al., 2011). The relationship between literacy exposure and VMI development is bidirectional: children who are actively engaged in letter-learning and pre-writing activities in preschool settings are simultaneously building the visual discrimination, directionality, and motor planning foundations that underlie VMI performance. This intersection is clinically relevant and is acknowledged as a study limitation below.
The measurement infrastructure required to track these outcomes longitudinally has historically been a limiting factor in OT outcomes research. Standard evaluation protocols typically capture a single snapshot of performance, and re-evaluation data, when it exists, is rarely structured for computational comparison. O.T. Wizard was designed to address this gap, enabling structured, reproducible, multi-domain measurement within the constraints of a standard clinical evaluation and supporting longitudinal outcome tracking that traditional paper-based protocols do not practically support.
This report also extends a prior O.T. Wizard longitudinal analysis (Wick, 2026) that examined 44 paired evaluations from the same clinical platform. The expanded sample of 71 pairs presented here confirms and extends those findings with consistent direction and strength across all eight domains assessed.
Key Findings
Overall Composite Performance
Across all 71 children with valid paired evaluations, mean composite score increased from 519.8 at Evaluation 1 to 646.0 at Evaluation 2, a mean raw gain of 126.2 points. Against the 9.2% natural growth expectation, the expected gain for this cohort was approximately 47.6 points. The observed gain exceeded the natural growth threshold by 78.6 points, representing 165% above expected developmental progress. To be precise about what that means: for every point of progress that natural maturation would have produced, these children gained 2.65 points. They moved forward at more than two and a half times the rate that developmental aging alone would have driven. That is not incremental. That is intervention doing exactly what skilled, structured, early occupational therapy is designed to do.
The gain was highly statistically significant (paired t-test, t=10.62, p<0.001, Cohen’s d=1.26, large effect). 89% of children showed improvement at the second evaluation. 42% of children began below the 500-point composite threshold; by Evaluation 2, only 17% remained below that threshold. Twenty children crossed the functional midpoint of the scale during the study interval.
89% of children improved. 20 children crossed the 500-point functional threshold.The composite gain exceeded expected natural growth by 165%.
Domain-Level Results
The following table presents results across all eight assessed domains, sorted by magnitude of gain above natural growth. All scores are pre-Rasch ordinal percentage values expressed as points within each domain’s maximum possible score. Natural Gain represents the expected gain based on the 9.2% natural growth rate applied to each domain’s Evaluation 1 mean.
Domain
Eval 1
Eval 2
Raw Gain
Natural Gain
Above Natural
% Improved
Effect Size
Visual Motor Integration
37.6
62.2
+24.6
3.4
+21.1 (614%)
94%
d=1.49 (Large)
Activities of Daily Living
45.5
69.2
+23.7
4.2
+19.5 (468%)
87%
d=1.27 (Large)
Fine Motor Skills
47.7
63.7
+16.0
4.3
+11.6 (268%)
86%
d=1.00 (Large)
Gross Motor Skills
56.8
72.3
+15.5
5.2
+10.3 (198%)
73%
d=0.77 (Medium)
Visual Perception
62.7
75.1
+12.4
5.7
+6.7 (118%)
77%
d=0.74 (Medium)
Praxis
52.1
56.6
+4.5
4.8
-0.3 (-6%)
48%
d=0.15 (ns)
Participation
65.2
69.4
+4.2
6.0
-1.8 (-30%)
62%
d=0.26 (*)
Executive Functioning
63.7
66.2
+2.5
5.8
-3.4 (-57%)
52%
d=0.15 (ns)
Table 1. Domain-level longitudinal comparison. Scores are points within each domain’s maximum possible score. Natural Gain = Eval 1 mean x 9.2% natural growth rate. Above Natural = Raw Gain minus Natural Gain. Effect sizes: Large (d>0.8), Medium (d>0.5). Executive Functioning, Participation, and Praxis findings are addressed in the discussion section. All scores are pre-Rasch raw values.
Visual Motor Integration produced the largest gain above expected growth in the dataset, rising from 37.6 to 62.2 points, a raw gain of 24.6 points against an expected natural gain of 3.4 points. The gain above natural growth was 21.1 points, representing 614% above what maturation alone would have produced. 94% of children with VMI scores showed improvement. The effect size of d=1.49 is considered large by conventional standards.
Activities of Daily Living showed a raw gain of 23.7 points against a natural expectation of 4.2 points, placing the gain above natural growth at 19.5 points (468% above expected). Fine Motor Skills showed 11.6 points above the natural expectation (268% above expected, d=1.00, large). Gross Motor Skills showed 10.3 points above expected (198% above expected, d=0.77, medium). Visual Perception showed 6.7 points above expected (118% above expected, d=0.74, medium).
Praxis, Participation, and Executive Functioning showed gains at or below the natural growth threshold, none with statistically significant large effects. The interpretation of these findings requires clinical context and is discussed in detail below. A dedicated companion analysis of the Participation and Executive Functioning longitudinal findings is forthcoming in this research series, as the novelty effect hypothesis and its implications for clinical documentation merit extended treatment.
Performance by Starting Age Band
The following table presents composite score change by starting age band. Natural growth rates vary slightly by band because younger children have a larger age progression ratio over the same elapsed time. Bands G and J are included for completeness but should be interpreted with caution given small sample sizes.
Age Band
n
Eval 1 Mean
Eval 2 Mean
Raw Gain
Above Natural
NGR
G (36-47.99 mo)
6
394.7
496.3
+101.7
+57.0
11.3%
H (48-53.99 mo)
29
516.6
651.3
+134.8
+84.8
9.7%
I (54-59.99 mo)
33
542.7
670.2
+127.5
+81.9
8.4%
J (60-65.99 mo)
3
549.7
628.0
+78.3
+32.8
8.3%
Table 2. Composite score change by starting age band. NGR = natural growth rate (months elapsed / age at Eval 1). Above Natural = Raw Gain minus (Eval 1 mean x NGR). Bands G and J interpreted with caution (small n).
Band H children (ages 48 to 53.99 months) showed the largest absolute gains above natural growth, averaging 84.8 points above the natural expectation on a composite gain of 134.8 points. Band I children showed 81.9 points above expected on a composite gain of 127.5 points. Both primary age bands show gains well above the natural growth threshold, and the difference between them is modest. This is broadly consistent with the earlier 44-pair analysis, which found Band H slightly outperforming Band I. The 48 to 54 month window continues to appear as a period of high clinical yield for OT service delivery, though both bands show substantial responsiveness.
Understanding the Flat Domains: Praxis, Participation, and Executive Functioning
Three domains showed gains at or below the natural growth threshold: Praxis (-6%), Participation (-30%), and Executive Functioning (-57%). These findings are clinically important to interpret carefully, as they do not simply mean that OT failed to produce change in these areas.
For Praxis, the near-zero gain is more likely a reflection of current measurement sensitivity than true insensitivity to intervention. Praxis is a complex, context-dependent construct requiring the integration of motor planning, bilateral coordination, and sequencing across novel tasks. Detecting incremental praxis development over a five-month interval likely requires either longer measurement windows or more precisely calibrated items. Rasch calibration of the praxis item bank is a priority in the continuing research agenda.
Participation and Executive Functioning tell a more nuanced story that involves the measurement context itself. Both domains are rated by the therapist based on behavioral observation during the evaluation. At Evaluation 1, the child is meeting the therapist for the first time. The novelty of the interaction, the structured environment, and the desire to engage with an unfamiliar adult may produce elevated ratings that reflect situational compliance rather than the child’s authentic behavioral baseline. By Evaluation 2, the therapeutic relationship is established and the child is comfortable enough to reveal their genuine regulatory and engagement patterns, including the variability and difficulty that characterize their daily functioning. If Evaluation 1 ratings are systematically elevated by this novelty effect, the apparent absence of gain at Evaluation 2 reflects a measurement context shift rather than a failure of intervention. A dedicated research blog on the novelty effect hypothesis and its implications for clinical documentation is forthcoming in this series.
Correlation Analysis
A moderate negative correlation was observed between starting composite score and magnitude of change (consistent with the 44-pair analysis). Children who began with lower scores tended to show larger gains. This regression-to-the-mean effect is expected in clinical samples and does not invalidate the findings, but is an important interpretive consideration. No significant correlation was found between inter-evaluation interval length and change score, indicating that the range of intervals in this cohort (approximately 37 to 173 days) did not materially influence the magnitude of observed gains.
Implications for OT Practice
The domain-level findings interpreted through the natural growth framework allow occupational therapists to make specific, evidence-informed decisions about evaluation and intervention priorities. Five domains showed gains ranging from 118% to 614% above the 9.2% natural growth threshold, all with statistical significance and large or medium effect sizes. These gains were achieved in a predominantly Medicaid-qualifying, low-income clinical population with significant developmental concerns, which makes the magnitude of change all the more clinically meaningful.
For insurance authorization and educational planning, the natural growth framework provides a communication tool that is both precise and accessible. Rather than reporting a raw score change, the practitioner can state that the child’s VMI performance exceeded the expected developmental rate by 21.1 points over approximately five months, providing clear evidence that skilled OT intervention, not maturation, drove the observed change. This framing is methodologically transparent and directly responsive to the medical necessity standards that payers apply.
The composite score threshold finding carries particular weight for authorization purposes. A child who begins services below the 500-point composite threshold and crosses it during the authorization period has demonstrated objectively measurable functional change. Of the 30 children who began below 500 points, 20 crossed that threshold during the study interval. That is a two-thirds success rate in moving children from below-threshold to at-threshold performance within a single authorization period.
Serial assessments using a consistent instrument also generate slope data that goes beyond a single outcome comparison. The rate of gain above natural growth, calculated at the domain level, can be used to project whether a child is on track to reach functional goals within a given authorization period, supporting proactive communication with payers and educational teams before a plateau needs to be explained rather than after.
Implications for Intervention Planning
The convergent large effect sizes across VMI, ADL, Fine Motor, and Gross Motor domains point toward a functional skill cluster that is highly responsive to structured OT programming during the preschool developmental window. These four domains share underlying requirements for postural control, bilateral coordination, and visually guided hand movement. Interventions that integrate these components across functional activities are supported by both the data pattern and established OT theory.
The Gross Motor finding is particularly relevant for intervention sequencing. A gain of 10.3 points above natural expectation with a medium-to-large effect confirms that proximal postural and movement foundations are responsive to OT services alongside distal fine motor work. For children showing limited fine motor or VMI gains, postural foundation and gross motor assessment should be considered before concluding that the upper extremity is the primary limiting factor.
For children whose evaluation profiles show strength in Gross Motor relative to Fine Motor and VMI, a proximal-to-distal intervention sequence may accelerate gains across the entire cluster. The strength of the ADL finding (d=1.27) reflects the functional integration that OT uniquely provides: when children gain in fine motor, VMI, and postural control simultaneously, daily living skills follow as a natural downstream effect.
The flat findings for Praxis, Participation, and Executive Functioning should not reduce the clinical attention given to these areas. They reflect current measurement constraints rather than evidence of non-response to intervention. Goal writing in these domains should continue, supported by structured therapist observation and emerging platform tools designed to capture behavioral change over longer intervals.
Study Limitations
This study carries several important limitations that readers should consider when interpreting and applying the findings.
The sample is clinical and geographically restricted to North Carolina. Findings cannot be generalized to typically developing children or to populations in other regions with different demographic profiles, service delivery models, or referral criteria. The absence of a control group means observed gains cannot be causally attributed to OT intervention. Natural maturation, regression to the mean, and test familiarity effects each contribute to observed change scores to an unknown degree.
The 9.2% natural growth correction is a methodologically transparent estimate derived directly from the age progression of this cohort on this instrument. It assumes proportional developmental scaling across the score range, an assumption that Rasch calibration will allow us to test empirically. Future work with a typically developing comparison group will allow domain-specific, empirically derived growth expectations to replace this uniform estimate.
The regression-to-the-mean effect means that domains with the lowest Evaluation 1 scores (VMI, ADL, Fine Motor) also showed the largest gains. The true intervention effect within these domains is likely substantial, but the proportion attributable to treatment versus regression toward the mean cannot be fully separated without a control group. All scores remain pre-Rasch ordinal percentage values. Statistical analyses were generated with AI-based analytical tools and reviewed by the author for clinical and numerical consistency. Final responsibility for interpretation rests with the author.An additional and important limitation specific to the VMI domain is the potential confounding effect of preschool attendance and literacy instruction.
A significant body of research demonstrates that access to quality preschool accelerates cognitive and academic skill development, with effects that are particularly pronounced for children from low-income households (Magnuson & Duncan, 2016; Bailey et al., 2024). Preschool curricula in the four-year-old age range routinely incorporate letter recognition, alphabet knowledge, pre-writing activities, and structured fine motor practice, all of which directly engage the visual-motor and orthographic processing skills that O.T. Wizard’s VMI domain measures. Because O.T. Wizard does not currently collect data on whether a child is enrolled in preschool, how many days per week they attend, or what literacy instruction they are receiving, it is not possible to separate the contribution of preschool-based literacy exposure from the contribution of OT services to the VMI gains observed. The large VMI gains reported here almost certainly reflect the combined influence of OT intervention, natural maturation, and classroom-based literacy and pre-writing instruction. Future data collection that captures school enrollment status and attendance patterns would allow this important confounder to be examined directly.
Band G (n=6) and Band J (n=3) findings should be treated as exploratory only. The Participation and Executive Functioning longitudinal findings are subject to the novelty effect interpretation described above, which cannot be confirmed or ruled out without the prospective study design described in the continuing research section.
Continuing Research Needed
Rasch calibration remains the highest research priority for O.T. Wizard. Transforming ordinal raw scores into interval-level person measures will allow true scale-independent longitudinal comparison, validate the proportional scaling assumption underlying the natural growth correction, and identify items requiring revision. Current analyses are pre-Rasch and should be interpreted as preliminary clinical evidence rather than psychometrically standardized measurement. The O.T. Wizard National Try-Out Team initiative is designed to expand sample sizes needed for stable item calibration across all domains and age bands.
A typically developing comparison group would allow the 9.2% natural growth estimate to be validated empirically and replaced with domain-specific growth expectations calibrated against external developmental benchmarks. Recruiting a non-clinical sample, even a modest one, would strengthen the interpretive framework considerably and provide a more precise foundation for the gain-above-expected metric.
The novelty effect hypothesis for Participation and Executive Functioning requires prospective investigation. A study design capturing therapist-rated engagement and work habits at multiple time points within the first year of services, alongside parent-reported and teacher-reported measures, would allow empirical testing of whether first-evaluation ratings systematically overestimate authentic baseline functioning.
Longitudinal expansion with test-retest intervals of 12 to 24 months would allow examination of whether early VMI and ADL gains are sustained through kindergarten entry, and whether children who make the largest gains above natural growth in the preschool period show measurably better school readiness outcomes. Linking O.T. Wizard composite and domain scores to standardized criterion measures, including teacher-rated school readiness and kindergarten entry assessments, would establish predictive validity and position the platform’s data within the broader early childhood outcomes literature.
Conclusion
This analysis of 71 preschool-aged children with paired O.T. Wizard evaluations, examined through a transparent natural growth framework, extends the domain-level outcome picture established in the February 2026 report. Across a mean interval of 4.85 months and a natural growth expectation of 9.2%, five of eight assessed domains showed gains that were statistically significant, clinically large in effect, and substantially above what maturation alone would produce.
89% of children improved overall. 20 children crossed the 500-point composite functional threshold during the study interval. Visual Motor Integration showed gains of 21.1 points above the natural expectation, 614% above what developmental maturation alone would predict over the same period. Activities of Daily Living and Fine Motor Skills showed gains of 468% and 268% above expected, respectively. These are not marginal differences. They represent functional gains at rates that developmental maturation cannot explain.
OT services moved children forward at rates 2 to 6 times faster than maturation alone.
These findings are preliminary. They require replication with larger samples, validated comparison conditions, and Rasch-calibrated measurement. What they establish is that structured domain-level digital assessment in pediatric OT can generate longitudinal outcome data that clearly and transparently distinguishes intervention-driven change from natural maturation. For a profession that has historically struggled to quantify its impact in terms that payers and educational systems recognize, that distinction is not a minor technical refinement. It is the foundation of evidence-based practice.
A six-part blog series examining what outcome data reveals about pediatric OT, what documentation systems currently miss, and how structured Response to Intervention measurement changes clinical practice is forthcoming in the O.T. Wizard Research Series beginning the week of March 9, 2026.
Disclosures
The author is the Founder and Clinical Architect of O.T. Wizard and has a financial interest in the platform. All analyses were conducted on de-identified clinical data collected in routine practice. Statistical analyses were generated with AI-based analytical tools and reviewed by the author for clinical accuracy and numerical consistency. Final responsibility for interpretation and reporting rests with the author. Data collection is ongoing. All data is de-identified in accordance with HIPAA regulations.
References
Daly, C. J., Kelley, G. T., & Krauss, A. (2003). Relationship between visual-motor integration and handwriting skills of children in kindergarten: A modified replication study. American Journal of Occupational Therapy, 57(4), 459-462. https://doi.org/10.5014/ajot.57.4.459
Duff, S. V., Chow, S. M., & Henderson, S. E. (2015). Developmental coordination disorder and its consequences for children. In A. F. Farrow & P. J. Tremblay (Eds.), Pediatric rehabilitation: Principles and practice (5th ed., pp. 189-215). Demos Medical Publishing.
Zwicker, J. G., Missiuna, C., Harris, S. R., & Boyd, L. A. (2012). Developmental coordination disorder: A review and update. European Journal of Paediatric Neurology, 16(6), 573-581. https://doi.org/10.1016/j.ejpn.2012.05.003Bailey, D. H., Duncan, G. J., Cunha, F., Foorman, B. R., & Yeager, D. S. (2024). Persistence and fadeout of educational-intervention effects: Mechanisms and potential solutions. Psychological Science in the Public Interest, 21(2), 55-116.Gerde, H. K., Zhao, Y., Shu, L., & Gagne, J. R. (2025). Evidence-based instructional support for early writing in preschool and kindergarten: A scoping review. Reading and Writing. https://doi.org/10.1007/s11145-025-10751-8Magnuson, K., & Duncan, G. J. (2016). Can early childhood interventions decrease inequality of economic opportunity? RSF: The Russell Sage Foundation Journal of the Social Sciences, 2(2), 123-141.
About O.T. Wizard
O.T. Wizard is a clinical intelligence system for pediatric occupational therapy professionals. The platform evaluates performance in evaluations, forms, and daily treatment notes across twelve domains including visual-motor integration, fine motor skills, gross motor skills, praxis, visual perception, executive functioning, activities of daily living, and participation. O.T. Wizard is undergoing Rasch analysis validation to establish psychometrically sound, norm-referenced scoring with living norms that update continuously as the clinical database expands. For information about O.T. Wizard research or accessing the platform, visit otwizard.com.
A descriptive snapshot from structured pediatric OT evaluation data (pre-Rasch)
Occupational therapists are trained to interpret evaluations one child at a time. What we rarely get to see is how our observations look in aggregate, across hundreds of evaluations completed using the same structure.
This article summarizes descriptive patterns from the PHI free data of OT Wizard’s preschool OT evaluation data collected since September 2025 using a consistent, structured evaluation framework. The goal is not to draw diagnostic or psychometric conclusions, but to surface real patterns that emerge when data is viewed collectively.
Sample Overview
Number of evaluations: 404
Approximate number of students: 404
Gender: Male: 56%, Female: 44%
Student Age range (two bands): 4:0-4:11.99
Primary Language Spoken: English: 90%, Spanish: 9%, Other: 1%
Primary Diagnosis: F82(Specific Dev Disorder of Motor Function): 95%, Autism: 5%
Sample is from preschoolers referred to OT evaluation; not a normative population sample
Total item-level data points: 19,062 normalized responses
Therapist Experience in this dataset
Average therapist experience: 10.3 years
Range of therapist experience: 3 to 30 years
Composite Scores (raw, non-Rasch)
Sample average composite score:559.7 /1000 (or 55.9%: Emerging Band)
Observed range:137 – 873 /1000 (or 13.7%-87.3%)
This wide range reflects substantial variability within a relatively narrow age span, reinforcing the importance of looking beyond single summary numbers.
Methods (brief and explicit)
Item-level results are based on normalized scores (0–1) , averaged across evaluations and excluding missing values. Domain and subdomain scores reflect the mean of available scores only; missing data were not treated as zero. No Rasch or item-response modeling has been applied at this stage.
Domain Scores (out of 100 points)
Ranked highest → lowest
Participation, 71
Executive Functioning, 67
Visual Perception, 63
Gross Motor Skills, 63
Praxis, 55
Fine Motor Skills. 53
Activities of Daily Living (ADL), 50
Visual Motor Integration, 42
Even when age bands are combined, the ordering remains stable. Participation and executive functioning consistently rank highest, while visual motor integration anchors the lower end of the distribution. However, even the highest score (Participation) is at the low range of Proficient.
Subdomain Scores (out of 100 points)
Ranked highest → lowest
Visual Discrimination, 74
Visual Figure–Ground, 71
Participation, 71
Work Habits (1:1 Therapy Setting), 67
Trunk Stability, 62
Hand Use, 62
Visual Memory, 56
Bilateral Integration, 61
Visual Spatial Relations, 55
Sequencing Praxis, 55
Dressing, 50
Scissor Use, 47
Pre Handwriting ,43
Speed and Accuracy, 43
Complex Visual Motor Representation & Integration, 38
Looking at the full ordering — not just the top or bottom — helps clarify where variation clusters across perceptual, motor, and participation-based constructs.
Item-Level Results (out of 100 points)
Normalized scores, ranked highest → lowest
Highest-ranking items
Match the shape (VP_VD_35), 100
Find the same shape (VP_VD_40), 100
What color is each bear? (VP_VD_47), 91
Dons slip-on shoes (ADL_DRESS_36), 100
Balance on one foot for 5 seconds (GM_TS_40), 86
Snip paper in at least one spot (FM_SCIS_6), 82
Dons simple front-opening coat (ADL_DRESS_33), 87
Transition performance during evaluation (EF_WORKHAB_5), 81
Several of these items show average normalized scores approaching or reaching 1.0.
Lowest-ranking items
Sequencing praxis: 4 steps with symbolic action (PR_SP_72)
Visual Memory (multiple VP_VM items)
Hop on one foot repeatedly (GM_TS_44)
Skip for multiple cycles (GM_TS_60, GM_TS_72)
Draw-A-Person task (VM_DAP)
Letters written legibly (VM_WANDPK4)
Pencil bubble popping (FMSAT) – non-dominant hand (POP_BUBB_11)
Latch a separated zipper (ADL_DRESS_54)
These items consistently fall at the lower end of the distribution across the combined preschool sample.
A necessary note about very high average scores
Items with average normalized scores near 1.0 may reflect several possibilities:
Developmentally easy tasks for much of the sample
Ceiling effects
Limited discrimination at this age range
Potential item misfit
Which explanation applies cannot be determined without psychometric modeling. These patterns are signals to investigate, not conclusions — and they help inform future Rasch analysis decisions.
Why this snapshot matters
None of these findings are surprising in isolation. What is meaningful is seeing how the entire evaluation system orders itself when applied consistently across hundreds of children.
This kind of ranking:
Makes implicit patterns visible
Highlights where variability concentrates
Provides a grounded baseline for future validation work
Most importantly, it reflects how structured OT evaluation data actually behaves — not how we assume it does when cases are viewed one at a time.
As this dataset grows and Rasch analysis is completed, these descriptive patterns will be tested, refined, and in some cases challenged. For now, they offer a clear, honest snapshot of the current data — and a strong foundation for what comes next.
About O.T. Wizard
Data for this analysis was collected through OT Wizard, a clinical intelligence system for pediatric occupational therapy assessment. The platform evaluates performance across up to twelve domains including visual-motor integration, fine motor skills, gross motor skills, praxis, visual perception, visual motor integration, executive functioning, activities of daily living, and participation. OT Wizard is undergoing Rasch analysis validation to establish psychometrically sound, norm-referenced scoring with living norms that update continuously as the clinical database expands.
Unlike traditional checklist-based assessments, OT Wizard converts all observations to continuous metrics that enable progress tracking, cross-domain comparison, and comprehensive reporting. The platform captures all six factors identified in this research as predictive of handwriting success: fine motor skills, visual perception (with subdomain specificity), praxis, cooperation, attention, and task participation. Behavioral regulation is assessed within the context of actual task performance rather than as an isolated rating, providing clinically relevant data about how attention and cooperation affect functional skill demonstration.
For handwriting readiness assessment specifically, OT Wizard provides quantified performance across visual discrimination, visual-motor integration, fine motor control, motor planning, and behavioral engagement during writing tasks. This comprehensive approach addresses the multifactorial nature of handwriting development identified in this research. As the platform undergoes Rasch analysis validation and accumulates longitudinal outcome data, it will establish whether comprehensive baseline assessment across all six predictors improves identification of children at risk for handwriting difficulty and informs more effective intervention planning.
OT Wizard is committed to advancing the occupational therapy profession by collecting de-identified clinical data from real therapist users, building the largest developmental database in pediatric occupational therapy history. This continuous data collection enables research on developmental trends, intervention effectiveness, and response to intervention patterns that elevate practice from perception-based to data-driven decision making and strengthen the evidence base for the entire profession
For OT professionals interested in data-driven assessment tools, visit otwizard.com to learn more about evidence-based pediatric evaluation.
You spent 90 minutes conducting a thorough pediatric occupational therapy evaluation. Another hour and a half writing a detailed report. You submitted it to insurance with confidence. Then the denial letter arrives: “Medical necessity not established.”
Sound familiar? You’re not alone. Insurance denials for occupational therapy evaluations are frustrating, time-consuming, and costly. But here’s the good news: most denials happen because of how the report is written, not whether the child actually needs services.
Let’s fix that.
The Insurance Approval Formula: Medical Necessity + Functional Impact + Skilled Service
Insurance companies don’t deny services because they don’t believe children need help. They deny because the documentation doesn’t prove three critical elements:
1. Medical Necessity: A documented diagnosis or condition that requires intervention 2. Functional Impact: Clear evidence that the condition limits daily functioning 3. Skilled Service: Proof that an occupational therapist’s expertise is required (not just supervision or general instruction)
Your evaluation report must explicitly address all three. If even one is missing or unclear, expect a denial.
What Insurance Reviewers Actually Read (And What They Skip)
Here’s a secret: the person reviewing your report spends about 90 seconds on it. They’re not reading every word. They’re scanning for specific elements. Most likely they are being read by their AI Bot.
The takeaway: Front-load your report with the information they need. Don’t bury medical necessity in paragraph seven.
The 7 Elements Every Insurance-Approved Report Contains
1. Clear Diagnosis at the Top
Wrong: “Johnny is a 5-year-old male referred for fine motor concerns.”
Right: “Johnny is a 5-year-old male with a diagnosis of Developmental Coordination Disorder (ICD-10: F82) referred for occupational therapy evaluation secondary to significant fine motor and visual-motor integration deficits impacting activities of daily living.”
Notice the difference? The second version includes diagnosis code, specific deficit areas, and functional impact in the first sentence.
2. Functional Limitations Stated Explicitly
Insurance doesn’t care that a child scores in the 5th percentile on the Beery VMI. They care that this score means the child cannot complete age appropriate functional activities, such as independently buttoning their shirt, writing their name legibly, or using utensils safely.
For every test score, include the “so what” statement:
Test Result: Visual perception skills measured at 2 standard deviations below age expectations on TVPS-4 (standard score: 70).
Functional Impact: This significant deficit prevents Johnny from independently locating items in his backpack, finding his desk in the classroom, and distinguishing similar letters (b/d, p/q) during early literacy tasks. Parent reports Johnny requires maximum assistance with dressing due to inability to orient clothing correctly.
3. Objective Measurements and Standardized Scores
Clinical observations alone don’t prove medical necessity. You need numbers.
Include :
Standardized test scores with percentiles or standard scores (like Peabody, Beery VMI) or Rasch-calibrated /Criterion referenced assessments (like PEDI-CAT, OT Wizard, or HELP)
Timed performance measures (e.g., “completed pegboard task in 145 seconds; age expectation is 45 seconds”)
Quantifiable observations (e.g., “grasped pencil in fisted grasp 100% of observed writing attempts”)
Measurable functional deficits (e.g., “required 4 verbal cues and 2 physical assists to don shirt”)
Research shows: Reports with comprehensive domain coverage across 8 areas (ADL, Executive Functioning, Fine Motor, Gross Motor, Visual Perception, Visual Motor Integration, Praxis, and Participation) have significantly higher approval rates because they provide objective evidence across multiple functional areas.
4. Medical Necessity Language (Not Educational Language)
If you primarily treat in schools, but are a medical based provider (meaning you aren’t an IEP provider), this is critical. Insurance reviewers don’t understand educational terminology.
Educational Language (Don’t Use): “Johnny requires OT services to access his educational curriculum and participate in classroom activities per his IEP.”
Medical Necessity Language (Use This): “Johnny requires skilled occupational therapy intervention to develop functional grasp patterns, visual-motor integration skills, and bilateral coordination necessary for age-appropriate self-care tasks including dressing, feeding, and personal hygiene.”
Key Differences:
Educational
Medical
Student
Patient
Classroom participation
Functional independence
IEP goals
Treatment goals
Educational benefit
Medical necessity
School activities
Activities of daily living
5. Safety Concerns (When Present)
Safety issues fast-track approvals. If present, state them clearly.
Examples:
“Child demonstrates impulsive behavior and poor body awareness, resulting in 3 falls from playground equipment in past month per parent report. Requires skilled OT intervention to develop safety awareness and motor planning.”
“Significant oral-motor deficits result in choking incidents during meals 2-3 times per week. Skilled feeding therapy required to establish safe swallowing patterns.”
“Decreased proximal stability and postural control result in frequent loss of balance during mobility, with 2 documented injuries requiring medical attention in past 6 months.”
6. Why Skilled OT is Required (Not Just Caregiver Training)
Insurance will deny if they think a parent or teacher could provide the same intervention. You must prove why your clinical expertise is necessary.
Not Skilled: “Child will benefit from practice with buttoning and zipping.”
Skilled Service: “Child requires skilled occupational therapy to analyze specific motor planning deficits preventing successful fastener manipulation, develop individualized strategies to compensate for bilateral coordination limitations, and systematically grade activity complexity while addressing underlying sensory processing difficulties that interfere with tactile discrimination necessary for fastener manipulation.”
See the difference? The second version demonstrates clinical reasoning, assessment expertise, and therapeutic skill that cannot be provided by non-therapists.
7. Concrete Frequency and Duration Recommendations
Vague recommendations get denied. Be specific.
Too Vague: “Recommend outpatient OT services.”
Specific and Justified: “Patient requires skilled occupational therapy 2x/week for 8 weeks (16 sessions) to address bilateral coordination deficits, visual-motor integration delays, and ADL skill development. Frequency based on severity of deficits (2+ standard deviations below age expectations across 4 domains) and need for motor learning repetition to establish new movement patterns. Re-evaluation recommended after 8-week intervention period to assess progress and determine ongoing needs.”
Common Denial Reasons and How to Avoid Them
Denial Reason #1: “Diagnosis not covered”
Prevention: Check the insurance company’s covered diagnosis list before evaluating. If the primary diagnosis isn’t covered, lead with a secondary diagnosis that is covered but still supports the need for OT.
Example: Autism (F84.0) might not be covered for outpatient OT, but Developmental Coordination Disorder (F82) or Sensory Processing Disorder coded as Other Specified Developmental Disorders (F88) often are.
Denial Reason #2: “Educational, not medical”
Prevention: Even if you’re a school-based therapist, emphasize ADL and home function impacts, not just classroom performance.
Include:
Dressing difficulties
Feeding/utensil use challenges
Hygiene and self-care limitations
Safety concerns at home
Community participation barriers
Denial Reason #3: “Not medically necessary”
Prevention: State explicitly in your report: “Skilled occupational therapy is medically necessary to address [diagnosis] which significantly impacts patient’s ability to [specific functional tasks], resulting in dependence on caregivers for age-appropriate self-care and safety concerns during daily activities.”
Denial Reason #4: “Insufficient objective data”
Prevention: Use standardized assessments. Clinical observations alone aren’t enough. Data from 404 evaluations shows that assessments with zero missing data and comprehensive domain coverage provide the objective evidence insurance requires.
The Report Structure Insurance Prefers
Section 1: Demographics and Diagnosis (Top of Page)
Name, DOB, date of evaluation
Primary diagnosis with ICD-10 code
Referring physician
Section 2: Medical Necessity Statement (First Paragraph) One clear paragraph stating diagnosis, functional limitations, and why skilled OT is required.
Section 3: Assessment Results
Standardized test scores
Functional performance observations
Quantifiable data
Each with functional impact statement
Section 4: Clinical Impressions
Summary of findings
How deficits impact daily function
Safety concerns (if applicable)
Section 5: Recommendations
Specific frequency (2x/week)
Specific duration (8 weeks)
Justification for both
Explicit medical necessity statement
Keep it concise: 2-3 pages maximum. Remember, they spend 90 seconds reading it.
Real Example: Before and After
Before (Gets Denied):
“Johnny is a pleasant 5-year-old boy who was referred for OT evaluation. He has difficulty with handwriting and gets frustrated during fine motor tasks at school. During testing, Johnny had trouble copying shapes and his pencil grasp looked immature. He would benefit from OT to work on these skills. Recommend weekly OT.”
Problems: No diagnosis code, no standardized scores, educational focus, vague recommendations, no medical necessity statement.
After (Gets Approved):
“Johnny is a 5-year-old male with Developmental Coordination Disorder (F82) referred for occupational therapy evaluation secondary to significant visual-motor and fine motor deficits impacting activities of daily living and self-care independence.
O.T. Wizard: Composite 550/1000, ADL 50/100, Fine Motor 72/100, Gross Motor 42/100, Sequencing Praxis 27/100, Visual Motor Integration 72/100
Functional grasp assessment: Fisted grasp pattern 90% of observed attempts
Functional Impact: Visual-motor integration and fine motor deficits prevent Johnny from independently managing fasteners (buttons, zippers, snaps), requiring maximum assistance for dressing. Unable to use utensils safely, resulting in frequent spills and parent reports of choking incidents 1-2x weekly. Cannot complete age-appropriate self-care tasks including tooth brushing and hair combing without hand-over-hand assistance.
Medical Necessity: Johnny requires skilled occupational therapy to develop functional grasp patterns, bilateral coordination, sequencing praxis, gross motor, and visual-motor integration skills necessary for age-appropriate self-care independence. Deficits 2 standard deviations below age expectations indicate significant impairment requiring therapeutic intervention. Safety concerns related to feeding and frequent falls during mobility necessitate skilled assessment and intervention.
Recommendations: Skilled occupational therapy 2x/week for 12 weeks to address bilateral coordination, visual-motor integration, and ADL skill development. Frequency based on severity of deficits and need for repetition to establish motor learning. Re-evaluation after 12 weeks to assess progress.”
Why it works: Diagnosis code in first sentence, standardized scores with functional impact, medical necessity explicitly stated, safety concerns noted, specific recommendations with justification.
Special Considerations for Different Settings
School-Based Therapists Seeking Medical Insurance Coverage
You can write reports that work for both IEP teams and insurance, but you need two versions:
IEP Version: Focus on educational impact and access to curriculum Insurance Version: Same data, different framing focused on ADL and medical necessity
Pro Tip: Complete your evaluation once, but generate two reports with different emphasis. Your assessment data doesn’t change, just how you present it.
Outpatient Clinic Therapists
You have an advantage because you’re already documenting medical necessity. Just ensure you’re:
Using covered diagnosis codes
Quantifying functional limitations
Stating skilled service needs explicitly
Providing specific frequency/duration with rationale
Early Intervention Providers
Insurance approval for 0-3 age range requires extra emphasis on:
Developmental delay severity (how far behind age expectations)
Impact on parent-child interaction
Safety concerns
Risk of further delay without intervention
The Bottom Line
Insurance approval isn’t about luck. It’s about documentation. Every denied evaluation report is missing at least one of these elements:
✓ Diagnosis code in first paragraph ✓ Standardized assessment scores ✓ Functional impact statements for every deficit area ✓ Medical necessity language (not educational) ✓ Explicit statement of why skilled OT is required ✓ Specific frequency and duration with justification ✓ Safety concerns (when applicable)
Master these seven elements, and your approval rate will skyrocket.
Stop spending hours appealing denials. Write it right the first time.
Streamline Insurance-Compliant Documentation
Writing insurance-approved reports doesn’t have to take hours. OT Wizard generates comprehensive evaluation reports with all required elements automatically included: diagnosis codes, standardized scores across 8 domains, functional impact statements, and medical necessity /educational eligibility. Choose medical or educational report tone with one click. Stop rewriting reports for insurance appeals.
Every pediatric occupational therapist has encountered this scenario: A 4-year-old with excellent fine motor skills, good visual perception scores, and established hand dominance still cannot write letters legibly. Meanwhile, another child with weaker motor skills and inconsistent grip produces surprisingly readable work.
What makes the difference?
New data from 185 preschool-age children reveals why handwriting success is so unpredictable and why our traditional assessment approaches may be missing critical pieces of the puzzle.
CURRENT HANDWRITING ASSESSMENT PRACTICES
Occupational therapists typically evaluate handwriting readiness through standardized assessments focusing on visual-motor integration and fine motor skills:
Beery VMI (Visual-Motor Integration), 6th Edition measures the ability to copy geometric forms of increasing complexity. Children progress from simple lines to complex shapes, with performance compared to age-based norms. The assessment assumes that shape copying ability predicts letter formation success.
PDMS-3 (Peabody Developmental Motor Scales, 3rd Edition) assesses fine and gross motor development through grasping and visual-motor integration subtests. The fine motor composite includes tasks similar to letter copying and provides age-based standard scores. While more comprehensive than the Beery VMI alone, it focuses primarily on motor execution.
BOT-2 (Bruininks-Oseretsky Test of Motor Proficiency, 2nd Edition) evaluates fine and gross motor proficiency including precision, integration, and manual dexterity tasks. Many subtests emphasize speed and accuracy under timed conditions, making it useful for identifying motor delays but less specific to handwriting readiness.
The Print Tool evaluates actual letter and number formation in children ages 3 to 7, rating legibility, size, spacing, and alignment. While more functional than shape copying, it requires children to already have some writing exposure.
Developmental Test of Visual Perception (DTVP-3) assesses visual-perceptual and visual-motor skills through tasks including copying, form constancy, and figure-ground discrimination. Performance on these isolated visual tasks is presumed to indicate readiness for integrated writing tasks.
Minnesota Handwriting Assessment evaluates speed, legibility, and form in school-age children who already write, making it less useful for identifying preschool readiness factors.
THE RESEARCH
We analyzed 185 children ages 4 to 4.5 years who received occupational therapy evaluations in North Carolina. This clinical sample consisted of children referred for developmental concerns, with 95 percent qualifying for Medicaid services. Many had limited exposure to structured preschool settings.
The children were given a comprehensive evaluation using O.T. Wizard and included 8-10 domains per child. During evaluation, children completed a letter copying task: 10 uppercase letters arranged from developmentally simple (L, F, R) to complex (S, X, N). Children copied each letter into a defined box below the model. Occupational therapists rated both the quality of letter production and the child’s behavior during the task.
The use of uppercase letter copying rather than geometric shapes in preschool assessment warrants clarification. For children lacking letter recognition, uppercase letters serve as geometric forms with the added benefit of providing functional, longitudinal work samples. Unlike abstract shapes that become irrelevant once writing instruction begins, letter samples document the progression from letters-as-shapes to letters-as-symbols, capturing both motor and cognitive development across the transition to formal writing.
We then examined how well various factors predicted performance on this functional handwriting task. Rather than assuming certain skills matter most, we calculated correlations to let the data reveal which factors actually related to success.
UNDERSTANDING CORRELATION: THE “r” VALUE
Before presenting findings, it helps to understand what correlation means and how to interpret the numbers.
Correlation measures the strength of the relationship between two variables. The correlation coefficient, represented as r, ranges from 0 to 1.0:
r = 0.0 to 0.1: No meaningful relationship
r = 0.1 to 0.3: Weak relationship
r = 0.3 to 0.5: Moderate relationship
r = 0.5 to 0.7: Strong relationship
r = 0.7 to 1.0: Very strong relationship
A simple example: Height and shoe size have a strong correlation (r = approximately 0.7). Taller people tend to wear larger shoes, though exceptions exist. The relationship is strong but not perfect.
In contrast, height and intelligence have essentially no correlation (r = approximately 0.0). Knowing someone’s height tells you nothing about their cognitive ability.
For our study, correlation indicates how well each skill predicts letter copying success. A high correlation means children with strong skills in that area tend to perform better on writing tasks. A low correlation means the skill does not reliably predict writing performance.
THE FINDINGS
Six factors showed moderate correlations with handwriting (visual motor integration) performance, all clustering tightly between r = 0.31 and r = 0.39:
Fine Motor Skills: r = 0.393
Cooperation (during evaluation): r = 0.365
Visual Perception: r = 0.340
Attention (during evaluation):r = 0.314
Praxis (Motor Planning): r = 0.314
Participation (during writing task): r = 0.310
The most striking finding is not which factor ranked highest, but rather that all six fell within an 8-point range. Fine Motor scored highest at 0.393, but Participation scored 0.310, a difference of only 0.083.
Statistical interpretation: All six predictors are moderate in strength, and none dominates. The child with the highest fine motor score has only a slightly better chance of writing success than the child with the highest cooperation score.
VISUAL PERCEPTION SUBDOMAINS: TASK DEMANDS MATTER
An interesting pattern emerged when examining visual perception subdomains separately. Not all visual skills predicted copying performance equally:
Visual Discrimination: r = 0.379
Visual Figure Ground: r = 0.304
Visual Spatial Relations: r = 0.158
Visual Memory: r = 0.137
Visual Discrimination, the ability to see small differences between similar forms, predicted letter copying better than the overall Visual Perception domain score. This makes perfect sense given the task demands. Copying letters requires discriminating between similar features: Is this a C or an O? Does this letter have a diagonal line or a curve? Are these two vertical lines parallel or converging?
In contrast, Visual Memory showed the weakest correlation at r = 0.137, barely above no relationship at all. This finding initially seems surprising given that handwriting literature often emphasizes visual memory as critical for letter formation. However, the weak correlation makes complete sense when we consider the actual task. Children were asked to copy letters with the model remaining visible throughout. They could look back and forth between the stimulus letter and their work as many times as needed. Visual memory is irrelevant when the visual information stays available.
Visual memory would matter for different handwriting tasks: Writing letters from dictation (hear the letter name, recall what it looks like) Writing spelling words independently (recall the letter in memory) Reproducing letters after brief exposure (look once, then write from memory)
But for direct copying with continuous visual access to the model, discrimination ability predicts success while memory does not.
This finding has important implications for assessment practices. If we evaluate visual memory but not visual discrimination, we may be measuring the wrong visual skill for near point copying tasks. Comprehensive assessment requires matching the skills tested to the actual task demands the child will face in the classroom.
In preschool and early kindergarten, children primarily engage in near point copying: copying letters from a worksheet placed directly in front of them, tracing over models, and reproducing shapes from a stimulus card on the table. These near point tasks allow continuous visual reference, making discrimination critical and memory less important.
As children progress through elementary school, task demands shift to far point copying: copying from the board, reproducing teacher demonstrations, writing from dictation. These tasks require visual memory because the model is not continuously accessible. A child must look at the board, hold the letter image in memory while looking down at paper, then reproduce from that mental representation.
For the preschool population in this study engaged in near point copying tasks, visual discrimination predicted success while visual memory did not. This relationship may change for older children performing far point copying or writing from dictation.
WHAT THE NUMBERS MEAN IN PRACTICE
Consider what these moderate correlations reveal:
If fine motor skills were the primary driver of handwriting, we would expect r = 0.6 or higher. Instead, r = 0.393 means fine motor capability explains only about 15 percent of handwriting performance. The remaining 85 percent depends on other factors.
Similarly, visual perception (r = 0.340) explains about 12 percent. Praxis explains about 10 percent. Cooperation explains about 13 percent.
No single factor accounts for even 20 percent of performance. Handwriting emerges from complex interactions among multiple systems, not mastery of any single prerequisite.
THE BEHAVIORAL FACTOR SURPRISE
Perhaps most notable: Behavioral factors predicted success as well as skill factors.
Cooperation (r = 0.365) nearly matched fine motor skills (r = 0.393). A child who cooperates with feedback and accepts correction has almost the same probability of writing success as a child with superior hand strength and coordination.
Attention during evaluation (r = 0.314) predicted exactly as well as motor planning ability (r = 0.314). The child who can focus for the duration of the task performs comparably to the child with better movement sequencing skills.
Participation during the actual writing task (r = 0.310) predicted nearly as well as any other factor. Willingness to engage with the challenge matters almost as much as capability.
This explains common clinical observations:
The child with excellent fine motor skills who gives up after one attempt struggles more than the child with weaker skills who persists through frustration.
The child who resists feedback and insists on doing it “my way” fails to improve despite adequate motor capability.
The child who cannot sustain attention long enough to complete three letters never accumulates the practice necessary for skill development.
CONTEXT MATTERS: THE 1-ON-1 EVALUATION PROBLEM
An important limitation: Cooperation, attention, and participation were rated during one-on-one evaluation sessions with an occupational therapist providing full support and individualized pacing.
This context differs dramatically from classroom writing instruction, where:
One teacher manages 15 to 20 students simultaneously Individual feedback is limited and delayed Pacing is group-determined rather than individualized Distractions are constant Tasks continue for extended periods without breaks
A child rated as having “adequate cooperation” in a quiet therapy room with undivided therapist attention may demonstrate very different behavior in a busy kindergarten classroom during 15-minute writing periods.
This suggests our correlations may actually underestimate the importance of behavioral factors. If cooperation, attention, and participation predict success even in optimal conditions, they likely matter even more in typical educational settings.
IMPLICATIONS FOR ASSESSMENT PRACTICES
Current handwriting readiness assessments focus heavily on visual-motor integration and fine motor skills while largely ignoring behavioral factors. The Beery VMI, for instance, requires sustained attention and task persistence to complete 30 forms, but these behavioral requirements are not scored or interpreted. A child may fail due to attention limitations rather than visual-motor deficits, yet both receive the same low score.
More critically, the Beery VMI is frequently used in isolation to qualify children for occupational therapy services for handwriting concerns. Given our findings, this practice is problematic. Visual-perception represents only one of six factors that predict handwriting success in preschoolers, and it predicts moderately (r = 0.340), not strongly. A child may score low on the Beery VMI yet succeed at functional handwriting due to strong cooperation, attention, and participation. Conversely, a child may pass the Beery VMI but struggle with classroom writing due to behavioral regulation challenges that the assessment does not capture.
Using the Beery VMI as a sole qualifying criterion systematically misidentifies which children need services. Comprehensive evaluation across all six predictive factors provides more accurate identification of handwriting risk.
Additionally, visual perception assessments for preschool populations should emphasize visual discrimination for near point copying tasks. Our findings demonstrate that for preschoolers copying letters with the model continuously visible, discrimination ability (r = 0.379) predicts substantially better than memory (r = 0.137). This does not suggest visual memory is unimportant for handwriting development overall. Rather, it indicates that the specific skills required depend on task type and developmental stage. Visual memory likely becomes increasingly important as children transition to far point copying and writing from dictation in elementary grades.
Ratings of current assessments used by OT’s and how they capture handwriting prediction
These assessments share common limitations. Based on our findings, we can evaluate how well each captures the six factors that actually predict handwriting success:.
Beery VMI (with supplemental tests): Rating 5/10 IF subtests administered. 3/10 if only the VMI section is administered. Captures visual-motor integration (r=0.340) through the primary copying task. Supplemental Visual Perception and Motor Coordination subtests add assessment of visual discrimination and fine motor control, bringing total coverage to 2-3 of 6 predictive factors. However, the Visual Perception subtest does not distinguish between visual discrimination (r=0.379, highly relevant) and visual memory (r=0.137, less relevant for near point copying). Completely misses cooperation, attention, praxis, and task participation. When administered with all three subtests, it provides more comprehensive data than VMI alone, but therapists often use only the primary VMI subtest for qualification decisions.
PDMS-3: Rating 6/10 Captures fine motor skills (r=0.393) through grasping subtests and visual-motor integration (r=0.340) through copying tasks. Provides 2 of 6 critical factors. Misses cooperation, attention, praxis, and task participation entirely. No assessment of behavioral regulation during tasks or visual discrimination as distinct from visual-motor integration.
BOT-2: Rating 4/10 Primarily assesses motor proficiency with fine motor precision and integration subtests capturing fine motor skills (r=0.393). However, heavy emphasis on timed performance may penalize slow-but-accurate children. Completely misses visual perception, cooperation, attention, and task participation. Designed for motor proficiency screening rather than handwriting-specific readiness. Captures only 1 of 6 predictive factors.
DTVP-3: Rating 5/10 Assesses visual perception (r=0.340) across multiple subdomains but does not distinguish between visual discrimination (r=0.379, highly relevant for copying) and visual memory (r=0.137, less relevant for near point tasks). Misses fine motor execution, cooperation, attention, praxis, and task participation. Provides visual skills assessment but in isolation from functional writing context.
The fundamental issue: These assessments emphasize isolated skill measurement (motor proficiency, visual perception, visual-motor integration) while ignoring behavioral regulation factors that predict equally well. Additionally, they provide scores but often rely on checklist observations that cannot be converted to continuous metrics for tracking progress or comparing across domains.
Comprehensive assessment should include:
Fine motor capability: Strength, coordination, precision, tool control Visual-perceptual skills with task-appropriate emphasis: Visual discrimination (critical for copying) Visual figure ground (moderate importance) Visual spatial relations (less critical for copying) Visual memory (only relevant for tasks without visible models) Motor planning: Ability to sequence multi-step actions, organize approach Cooperation: Willingness to accept feedback, modify approach when unsuccessful Attention: Capacity to sustain focus through multi-step tasks Task participation: Engagement level, persistence through challenge, frustration tolerance
Single-domain screening (testing only visual skills or only motor skills) will systematically miss children at risk. A child may pass fine motor screening with flying colors but struggle with writing due to attention deficits, poor cooperation, or low task engagement.
Similarly, a child may score well on visual memory subtests but fail at letter copying due to poor visual discrimination. Matching assessed skills to actual task demands is essential.
Conversely, a child with borderline fine motor scores but strong behavioral regulation may achieve functional writing through persistence and acceptance of instruction.
IMPLICATIONS FOR INTERVENTION
Traditional intervention models often follow a sequential approach: establish attention, then build fine motor skills, then introduce visual tasks, then combine into writing. Our data suggests this may be inefficient.
If multiple factors contribute equally and simultaneously, intervention should address them concurrently rather than sequentially. Children need practice integrating behavioral regulation, motor control, visual processing, and motor planning from the start.
Effective intervention might include:
Brief, varied tasks that build attention capacity while practicing motor skills (address both simultaneously) Immediate feedback on both motor execution and behavioral approach (cooperation, persistence) Functional writing activities that require visual processing, motor planning, and sustained attention in authentic context Explicit instruction in self-regulation during challenging tasks (managing frustration, accepting correction)
Isolated prerequisite activities (strengthening exercises, shape sorting, sequencing games) practiced separately from writing context may not transfer effectively. The child builds attention during tabletop games but cannot apply it during writing. The child demonstrates fine motor control during bead threading but not during letter formation.
Integration practice appears more efficient: Work on attention, motor control, visual processing, and cooperation simultaneously within functional writing activities.
WHY SOME CHILDREN SUCCEED DESPITE LIMITATIONS
These findings explain puzzling clinical observations.
The child with weak fine motor skills who succeeds likely compensates through: Strong visual perception (carefully observes letter features) High persistence (keeps trying despite motor difficulty) Good cooperation (accepts feedback, modifies approach) Strong attention (focuses carefully on each stroke)
The combination of strengths in four areas compensates for weakness in one.
The child with excellent fine motor skills who fails likely struggles with: Poor attention (loses focus mid-letter) Low persistence (gives up when first attempt is imperfect) Resistance to feedback (insists on incorrect approach) Low task engagement (avoids writing activities)
Motor capability alone cannot overcome behavioral limitations.
THE CLINICAL SAMPLE CONTEXT
These findings emerge from a specific population: low-income preschoolers referred for occupational therapy evaluation. Many had limited exposure to structured educational settings or formal writing instruction.
This context matters for interpretation:
Children with school experience might show different patterns, as they have had more opportunity to develop attention and cooperation within structured tasks.
Higher-income samples with more educational exposure might demonstrate stronger correlations for skill factors and weaker correlations for behavioral factors.
Typically developing children (not referred for therapy) might show different relationships among variables.
However, this clinical sample represents the population occupational therapists actually serve. Understanding what predicts success in children with developmental concerns and limited educational exposure has direct clinical relevance.
RESEARCH CONTEXT: HOW OUR FINDINGS COMPARE
Our findings align with and extend existing research on handwriting development while revealing some important differences.
Feder and Majnemer (2007) conducted a systematic review identifying visual-motor integration, fine motor skills, and in-hand manipulation as significant predictors of handwriting performance in school-age children. Their meta-analysis found moderate correlations (r = 0.3-0.5) between these factors and handwriting, consistent with our fine motor (r = 0.393) and visual perception (r = 0.340) findings. However, their review focused on older children already engaged in writing instruction, while our sample examined preschoolers in pre-handwriting stages.
Reference: Feder, K. P., & Majnemer, A. (2007). Handwriting development, competency, and intervention. Developmental Medicine & Child Neurology, 49(4), 312-317.
Volman, van Schendel, and Jongmans (2006) examined handwriting readiness in kindergarten children and found that visual-motor integration was a significant predictor but explained only a modest portion of variance. This supports our finding that visual-motor skills predict moderately (r = 0.340) but do not dominate. Importantly, they also identified attention and behavioral regulation as contributing factors, aligning with our cooperation (r = 0.365) and attention (r = 0.314) findings.
Reference: Volman, M. J., van Schendel, B. M., & Jongmans, M. J. (2006). Handwriting difficulties in primary school children: A search for underlying mechanisms. The American Journal of Occupational Therapy, 60(4), 451-460.
Kaiser, Albaret, and Doudin (2009) investigated the relationship between handwriting quality and various factors in first graders. They found visual perception, fine motor skills, and graphomotor skills all contributed, but no single factor was sufficient. Their findings that multiple factors contribute equally strongly support our multifactorial model. However, they did not examine behavioral factors like cooperation or task-specific participation, which our data suggests are equally important.
Reference: Kaiser, M. L., Albaret, J. M., & Doudin, P. A. (2009). Relationship between visual-motor integration, eye-hand coordination, and quality of handwriting. Journal of Occupational Therapy, Schools, & Early Intervention, 2(2), 87-95.
Notably absent from existing literature: Studies examining task-specific participation and cooperation as predictors of handwriting success in preschool populations. Most handwriting research focuses on school-age children who have already received writing instruction and emphasizes motor and perceptual factors while treating behavioral factors as confounding variables rather than legitimate predictors.
Our finding that cooperation predicts nearly as well as fine motor skills (r = 0.365 vs r = 0.393) extends the literature by demonstrating that behavioral regulation deserves equal consideration in handwriting readiness assessment. The clinical sample context (children referred for evaluation, limited school exposure, 95 percent low-income) may explain why behavioral factors emerged as stronger predictors than in general population studies.
Additionally, our visual perception subdomain analysis revealing that visual discrimination (r = 0.379) predicts substantially better than visual memory (r = 0.137) for near point copying tasks provides specificity often missing in broader visual perception assessments. This has practical implications for selecting which visual subtests to administer when evaluating preschool handwriting readiness.
ABOUT OT WIZARD
Data for this analysis was collected through OT Wizard, a clinical intelligence system for pediatric occupational therapy assessment. The platform evaluates performance across up to twelve domains including visual-motor integration, fine motor skills, gross motor skills, praxis, visual perception, executive functioning, activities of daily living, and participation. OT Wizard is undergoing Rasch analysis validation to establish psychometrically sound, norm-referenced scoring with living norms that update continuously as the clinical database expands.
Unlike traditional checklist-based assessments, OT Wizard converts all observations to continuous metrics that enable progress tracking, cross-domain comparison, and comprehensive reporting. The platform captures all six factors identified in this research as predictive of handwriting success: fine motor skills, visual perception (with subdomain specificity), praxis, cooperation, attention, and task participation. Behavioral regulation is assessed within the context of actual task performance rather than as an isolated rating, providing clinically relevant data about how attention and cooperation affect functional skill demonstration.
For handwriting readiness assessment specifically, OT Wizard provides quantified performance across visual discrimination, visual-motor integration, fine motor control, motor planning, and behavioral engagement during writing tasks. This comprehensive approach addresses the multifactorial nature of handwriting development identified in this research. As the platform undergoes Rasch analysis validation and accumulates longitudinal outcome data, it will establish whether comprehensive baseline assessment across all six predictors improves identification of children at risk for handwriting difficulty and informs more effective intervention planning.
OT Wizard is committed to advancing the occupational therapy profession by collecting de-identified clinical data from real therapist users, building the largest developmental database in pediatric occupational therapy history. This continuous data collection enables research on developmental trends, intervention effectiveness, and response to intervention patterns that elevate practice from perception-based to data-driven decision making and strengthen the evidence base for the entire profession
From time to time, we invite occupational therapy practitioners whose use of OT Wizard reflects strong clinical reasoning, real-world application, and thoughtful feedback to participate in a spotlight.
User spotlight with Hailey, OTR/L
Can you tell us a little about your background as an OTP, and your work setting(s) ?
I am currently in my 6th year as an OT and all 6 have been within the school-based setting. I have dabbled in outpatient pediatrics, as well, by my heart is absolutely within school-based delivery.
Do you have a favorite domain or type of challenge you enjoy treating most? What do you love about it?
I would say that visual deficits are my favorite challenge; they’re often easily missed or overlooked, but play such a foundational role in the development of motor skills.
What does a “normal” day look like for you?
This year specifically, I am balancing a lot of evaluations and supervision of COTAs (I have an amazing team of COTAs)! I also spend time bouncing between pre-k classrooms and treating a handful of pre-k and elementary aged students.
How did you hear about OT Wizard?
Our school-based therapy team registered for the Learning Charms Conference this past fall. As soon as the platform was presented, we knew we needed to be utilizing it. We’ve had no regrets!
Before subscribing to OT Wizard, what made you hesitant about trying OT Wizard?
We’re so accustomed to only reaching for standardized assessments that have been around for decades or piecing together an informal observation checklist. Also, I was a little intimidated by the AI feature.
What made you feel OT Wizard could work in your setting(s)?
After learning about the time, experience, and dedication that was poured into creating this tool, I felt a lot more comfortable with the idea of it. Hearing the statistics regarding efficiency, along with the opportunities for collaboration within the profession, made me even more sure.
Was there a moment where OT Wizard really “clicked” for you?
I would have to say that it clicked after I had the chance to utilize it with a few students, alongside each COTA on our school-based team. Familiarizing myself with the platform, each task I was asking the students to do, and the various forms and report generators was key. Stephanie has also made this whole platform SO user friendly; frequently sending helpful tips, new features and asking for feedback.
How has OT Wizard changed your approach to evaluations or reports now, even in small ways?
I walk into an evaluation feeling much more prepared, knowing that I have a variety of evaluation tools at the click of a button. I have also enjoyed the report generator; I’m still old school and like to type my own report first, but the verbiage of the wizard has definitely improved my end result.
What is your favorite feature in OT Wizard?
I’ve LOVED using the (digital) forms that can be sent to teachers, specifically the sensory one. It’s so comprehensive, and the summary of results is easy to interpret and present to IEP team members.
What would you say to another OTP who’s feeling hesitant or skeptical about trying OT Wizard?
DO IT! Don’t think twice! There are so many incredible features that can be utilized across pediatric settings.
What’s one thing you don’t miss doing since using OT Wizard?
Creating the eligibility justification. OT Wizard generates a well-worded, individualized statement, based on all of the data collected on the specified student.
In addition to what Hailey mentioned, she’s been a champion for using many, if not all of the features within OT Wizard. She reaches out when she has questions and is diligent in making sure she understands best practice use. For these reasons, this OT Wizard hat is well deserved.
I’m thrilled to announce that OT Wizard has officially begun psychometric validation through Rasch analysis – a major milestone in our journey to elevate evidence-based practice in pediatric occupational therapy!
What’s Happening Now
We’ve sent evaluation data for ages 4-5 years (Age Bands H & I) to an independent psychometrician for comprehensive analysis. With over 400 evaluations from 18 therapists across North Carolina, we have robust data to validate that OT Wizard measures what we say it measures & accurately, reliably, and fairly.
What Is Rasch Analysis?
Rasch analysis is a sophisticated psychometric approach that goes beyond traditional test validation. Unlike norm-referenced assessments that simply compare students to each other, Rasch analysis creates an interval-level measurement scale, similar to measuring temperature or weight.
Think of assessments you may know that use Rasch methodology:
HELP (Hawaii Early Learning Profile) – Rasch-validated developmental assessment
Original PEDI – Rasch-based functional assessment
These assessments are considered gold standards because Rasch analysis ensures:
Equal intervals: A 10-point gain at any level represents the same amount of growth
Sample-independent measurement: Item difficulty doesn’t depend on who takes the test
Missing data handling: Scores are valid even when not all items are administered (adaptive testing)
Precise error estimation: Know exactly how confident you can be in each score
Item hierarchy validation: Confirms items are developmentally sequenced correctly
Why Rasch Instead of Traditional Norming?
Traditional norm-referenced tests (like BOT-3, PDMS-3) require testing typically-developing children to create percentile ranks. That’s valuable, but has limitations:
Norms become outdated (tests re-normed every 15-20 years) Percentiles are ordinal, not interval (85th→95th ≠ 15th→25th in actual ability) Can’t track growth accurately across different ability levels Require complete test administration
Rasch analysis provides:
Continuous measurement scale – Track growth precisely over time Adaptive testing – Administer only relevant items, still get accurate scores Sample-independent – Item difficulty stays stable regardless of who’s tested Living calibration – Can update and refine continuously with new data Clinical utility – Scores directly interpretable for intervention planning
We’re building OT Wizard to work like the PEDI-CAT and AMPS. These are tools that OTs trust because they’re built on rigorous Rasch foundations.
What We Already Know About Our Data
Before even sending data to our psychometrician, we conducted preliminary analysis on our 404 evaluations to ensure data quality. Here’s what we’ve learned:
Strong Sample Characteristics
Well-balanced age distribution: 184 evaluations (ages 4.0-4.4) and 220 evaluations (ages 4.5-4.9)
18 therapists contributing: Average of 22 evaluations each, with range of 7-45 per therapist (good for inter-rater reliability)
Diverse language backgrounds: 90% English, 8% Spanish, 2% other languages
Clinical population validity: 96% recommended for OT services
Excellent Data Completeness
Zero missing responses – every administered item was answered
75.5% average completion rate – our adaptive basal/ceiling rules are working perfectly
19,062 total data points across 74 items and 8 domains
Strong Domain Coverage
Visual Perception: 15 items
Activities of Daily Living: 14 items
Gross Motor & Fine Motor: 10 items each
Participation: 9 items
Executive Functioning: 8 items
Visual Motor Integration: 5 items
Praxis: 3 items
Areas for Improvement Identified
Our preliminary analysis flagged several items for the psychometrician to examine closely:
Ceiling Effects in Visual Perception (Preschool evaluation): 56% of responses scored at ceiling (mastered), with 33% at floor (not yet observed). This bimodal pattern suggests we may need more mid-difficulty items to better differentiate students in the middle range.
Rating Scale Consistency: A small number of responses (3.3%) showed raw scores instead of normalized scores, indicating a formula issue we’ve already corrected.
Developmental Anchor Gaps: About 54% of items (primarily Executive Functioning and Participation domains) lack developmental anchors. The Rasch analysis will empirically determine difficulty levels so we can assign appropriate anchors.
Item-Age Alignment: Many items administered are anchored above student age ranges (51-55% above range). This is actually expected and appropriate. Students with developmental delays are working on skills typically seen at older ages. However, Rasch will help us recalibrate anchors based on clinical population performance vs. typical development.
Best-Performing Domains
ADL: Excellent distribution with only 8% floor and 8% ceiling – items are well-targeted
Executive Functioning: Minimal floor effect (0.7%), good spread across ability levels
This preliminary work means we’re sending clean, robust data to our psychometrician. This is maximizing the value of the Rasch analysis and ensuring reliable results.
What’s Being Analyzed
Our psychometrician is conducting comprehensive Rasch analysis across multiple dimensions:
1. Construct Validity (Unidimensionality)
Do items within each domain (Gross Motor, Fine Motor, Visual Perception, etc.) measure a single, coherent construct? This is critical for Rasch – if items don’t “hang together,” they can’t be on the same measurement scale.
2. Item Fit
Which items contribute to reliable measurement? Rasch provides specific fit statistics (infit/outfit MNSQ) showing whether each item:
Is too predictable (doesn’t add information)
Is too unpredictable (confuses the measurement)
Functions optimally (contributes to precise measurement)
Items outside acceptable ranges get flagged for revision or removal.
3. Rating Scale Functioning
Do our 5-point performance bands (Beginning → Mastered) function as intended? Rasch examines:
Are all categories used appropriately?
Do response thresholds advance in the right order?
Should categories be collapsed (e.g., 5-point → 3-point)?
This is similar to how AMPS validates its 4-point scoring scale.
4. Item Hierarchy
Rasch places all items on a single difficulty scale (measured in logits). We’ll see if:
Items anchored at 48 months are empirically easier than 54-month items
Our developmental sequencing matches actual difficulty
Gaps exist where we need additional items
This will be especially important for items currently lacking developmental anchors – the Rasch analysis will tell us where they belong.
5. Measurement Precision
Unlike traditional reliability (one number for whole test), Rasch shows precision at every ability level:
Where is measurement most accurate?
What’s the standard error at our 70% clinical threshold?
Can we distinguish between students with small ability differences?
6. Differential Item Functioning (DIF)
Do items work the same way for:
Boys vs girls?
4-year-olds vs 5-year-olds?
English vs Spanish speakers?
Different diagnoses?
Items showing bias get flagged or removed – ensuring fairness.
7. Person Separation
Can we reliably distinguish between students at different ability levels? Rasch provides a separation index showing how many distinct ability levels we can measure. Higher separation = more precise clinical distinctions.
8. Addressing Known Issues
The psychometrician will specifically examine:
Visual Perception’s ceiling effects : do we need additional mid-difficulty items?
Praxis domain with only 3 items : is this sufficient or should it combine with another domain?
Executive Functioning and Participation rating scales : do they function as separate constructs from performance-based items?
Why This Matters for You
Rasch validation transforms how you can use OT Wizard scores:
Meaningful Progress Monitoring
Because Rasch creates interval-level measurement, you can confidently say:
Traditional percentage scores can’t make these claims and a jump from 40% to 50% isn’t necessarily the same growth as 70% to 80%.
Adaptive Testing Validation
Like the PEDI-CAT and AMPS, OT Wizard uses basal/ceiling rules so students aren’t frustrated with too-hard items or bored with too-easy ones. Rasch analysis confirms:
Scores are comparable even when different items are administered
Our 75% completion rate is optimal
Missing items are appropriately “not administered,” not missing data
Credible Clinical Decisions
When you document that a child’s gross motor ability is at -1.2 logits:
School districts understand the methodology (same as PEDI-CAT/HELP)
You can defend your clinical reasoning with published psychometric evidence
Item-Level Interpretation
Rasch analysis creates item hierarchy maps showing exactly which skills a child has mastered, which are emerging, and which aren’t yet present. This directly informs intervention planning just like how AMPS users identify specific ADL breakdowns or PEDI-CAT shows functional skill patterns.
Why Start with Ages 4-5?
We strategically chose this age range because:
Sufficient sample size: 400+ evaluations provide robust statistical power for Rasch analysis
Diverse representation: Students with various diagnoses, languages, and ability levels
Multiple raters: 18 different therapists ensure inter-rater reliability analysis
Item overlap: Many items in this age range also appear in adjacent ages, so findings inform the entire platform
Strong data quality: Our preliminary analysis confirmed excellent completion rates and coverage
The psychometrician will identify any problematic items, validate our developmental anchors, assign anchors to items missing them, and ensure rating scales function optimally. We’ll implement improvements before these issues cascade into other age bands.
What Happens Next
Based on the psychometrician’s findings (expected in 4-5 weeks), we’ll:
Remove or revise misfitting items that don’t meet Rasch fit criteria
Add mid-difficulty items to Visual Perception domain to address ceiling effects
Optimize rating scales if analysis shows categories aren’t functioning as intended
Recalibrate existing anchors if clinical population performance differs from typical development
Establish measurement precision estimates at different ability levels
Publish validation statistics you can cite in reports and presentations
This refined version becomes the foundation for validating additional age bands.
Expanding Validation: Ages 3 Months to 12 Years
Over the next 12 months, as we reach 200+ evaluations per age band, we’ll validate each additional age group. This will create a comprehensive, linked measurement system similar to how PEDI-CAT links across age ranges where we can:
Track individual students across multiple years on the same logit scale
Provide age-equivalent scores based on item difficulty calibration
Create clinical reference data comparing students receiving OT services
Document growth trajectories with true interval-level measurement
Demonstrate outcomes with unprecedented precision
By Month 12, we’ll conduct a comprehensive linking study that places all age bands (3 months through 12 years) on a single, continuous measurement scale. Items that appear in multiple age bands will “anchor” the scales together, ensuring continuity.
This approach mirrors how major Rasch-based assessments (PEDI-CAT, AMPS, HELP) maintain measurement continuity across ages and versions.
How You Can Support This Work
1. Keep Using OT Wizard
Every evaluation you complete contributes to our growing database. Rasch analysis becomes more robust with larger samples and the more data we collect, the more confident we can be in item calibrations.
Brittany B., administers an eval with OT Wizard
2. Share Your Clinical Insights
If you notice items that seem:
Confusing or ambiguous to score
Too easy or too hard for the age range
Misaligned with what you observe clinically
Culturally biased or inappropriate
Please let us know! Your real-world feedback is invaluable. Rasch analysis will identify statistical misfits, but your clinical judgment helps us understand why items aren’t working.
What This Means for Our Profession
Most therapy documentation tools rely on subjective clinical observation. While tools like PEDI-CAT, AMPS, COPM, and HELP exist and use Rasch methodology, they’re limited in scope and focus on narrow or specific functional domains, requiring specialized training, or covering narrow age ranges.
OT Wizard is different: We’re creating a comprehensive, Rasch-validated clinical intelligence platform that covers:
Birth through early adulthood (3 months – 18 years)
Performance-based, participational based, and functional assessment
Integrated into everyday clinical workflow
By pursuing rigorous Rasch validation, we’re increasing psychometric rigor to comprehensive pediatric OT assessment.
When this validation is complete, you’ll be able to say:
“I use OT Wizard, a comprehensive Rasch-validated pediatric OT assessment platform with published psychometric evidence across 2,000+ evaluations providing the same measurement quality as tools like PEDI-CAT and AMPS, but covering all developmental domains.”
The Vision: Living Calibration and Real-Time Data
Here’s what excites me most about Rasch methodology: Unlike traditional norm-referenced tests that become frozen in time, Rasch-calibrated assessments can be continuously refined.
The PEDI-CAT has demonstrated this – as more data is collected, item calibrations can be updated, new items added, and measurement precision improved all while maintaining the same measurement scale.
OT Wizard will have “living calibration”:
Continuous item refinement as we collect more data
New items added to fill gaps in difficulty coverage
Real-time quality monitoring
Annual recalibration studies
Regional and demographic analyses
Imagine:
Item difficulties that reflect current populations
Outcome analytics showing which interventions are most effective
Predictive data identifying which early skills best predict later success
The world’s largest real-time Rasch-calibrated pediatric development database
Every evaluation you complete contributes to this unprecedented resource.
Thank you for building the future of evidence-based OT assessment with O.T. Wizard.
From time to time, we invite occupational therapists whose use of OT Wizard reflects strong clinical reasoning, real-world application, and thoughtful feedback to participate in a spotlight. These OTP’s have earned their wizard hats.
Meet Krystal Watkins, MS, OTR/L, ADSCS
Can you tell us a little about your background as an OTP, and your work setting(s) ?
I am an Occupational Therapy Practitioner with 8.5 years of experience working across a wide range of settings. My background includes skilled nursing facilities (SNF), acute care, outpatient therapy, early intervention, home health, and school-based practice, which has given me a strong clinical foundation. Over time, my passion has increasingly focused on pediatric practice, particularly working with children with autism and ADHD in educational and community-based settings. I enjoy supporting students’ sensory processing, self-regulation, attention, and functional participation to help them succeed in their daily routines at school and home. I am eager to continue growing professionally and look forward to pursuing additional certifications related to ADHD to further strengthen my ability to support this population.
Do you have a favorite domain or type of challenge you enjoy treating most? What do you love about it?
My favorite domain to work in is supporting students with autism and ADHD in school-based settings. What I love most about this work is how meaningful and practical it is. I enjoy helping students build the regulation, attention, sensory processing, and executive functioning skills they need to participate successfully in their daily school routines. Every child is different, and I find it rewarding to problem-solve creatively whether that means adapting the environment, using sensory-based strategies, or breaking tasks down so a student can experience success. I’m especially passionate about empowering students to better understand their own needs and strengths while collaborating closely with teachers and families. Seeing a child gain confidence, independence, and improved participation in the classroom even through small but significant gains is what makes this work so fulfilling for me.
What does a “normal” day look like for you?
As a school-based occupational therapist, a “normal” day is a balance of planning, direct treatment, and collaboration. I typically start my day by treatment planning and organizing materials to prepare for the students on my caseload. Throughout the day, I provide direct OT services to students, working on goals related to sensory regulation, fine motor skills, executive functioning, and classroom participation. In addition to treatment sessions, I regularly conduct evaluations and re-evaluations, complete documentation, and adjust intervention plans as needed. Collaboration is a key part of my daily routine. I spend time communicating with teachers, support staff, and other members of the school team to problem solve strategies and ensure consistency across environments. Each day is busy and varied, but the mix of hands on work, planning, and teamwork makes the role both dynamic and rewarding.
How did you hear about OT Wizard?
I heard about OT Wizard through a COTA friend who shared their experience and recommended it to Rockingham County Schools.
Before subscribing to OT Wizard, what made you hesitant about trying OT Wizard?
I wasn’t hesitant at all. I was actually excited to try something new and explore a tool that could support my work as an OT.
What made you feel OT Wizard could work in your setting(s)?
I felt OT Wizard could work well in my school-based OT setting because it provides practical resources and tools that directly support my work with students. Having access to ready to use evaluations helps me save planning time, stay organized, and tailor therapy to each child’s needs. It integrates seamlessly into a busy school day, where balancing evaluations, direct therapy, and collaboration with teachers is essential.
Was there a moment where OT Wizard really “clicked” for you?
Yes, there was a moment where OT Wizard really “clicked” for me when I realized how much time it could save on planning and documentation. I was able to quickly pull a ready to use evaluation and immediately tailor it for a student, all while feeling confident that it was thorough and appropriate.
How has OT Wizard changed your approach to evaluations or reports now, even in small ways?
Yes, It allows me to focus more on interpreting results and planning meaningful interventions rather than spending excessive time formatting or creating forms. Overall, it’s made the process more efficient, thorough, and less stressful, so I can dedicate more energy to supporting my students.
What is your favorite feature in OT Wizard?
My favorite features in OT Wizard are the Magic W.A.N.D. and the occupational profile section in the guided evaluations. The Magic W.A.N.D helps assess and identify writing difficulties. The Magic W.A.N.D. gives clear, structured insight into a student’s writing challenges. The occupational profile offers self-reflection type of questions that engage students in their own progress and provide valuable information about their perspectives, strengths, and needs. Both features make evaluations more interactive and meaningful.
What would you say to another OTP who’s feeling hesitant or skeptical about trying OT Wizard?
Give it a try! OT Wizard is designed to make your work easier, more organized, and more student-centered. The ready to use evaluations, tools, and resources save planning time and help you focus on what really matters which is supporting your students’ progress.
What’s one thing you don’t miss doing since using OT Wizard?
I don’t miss spending hours creating and formatting evaluation forms and reports from scratch. With ready to use templates and tools, I can focus on interpreting results and planning interventions instead of getting bogged down in paperwork. It’s been a huge time-saver and stress-reliever!
In addition to what Krystal shared here, she has been a beta tester of both OT Wizard v1 and v2, demonstrating flexibility and patience as the platform evolved. Throughout that process, she consistently showed curiosity and a willingness to learn new technology in service of her clinical work. For these reasons, this OT Wizard hat is well deserved.
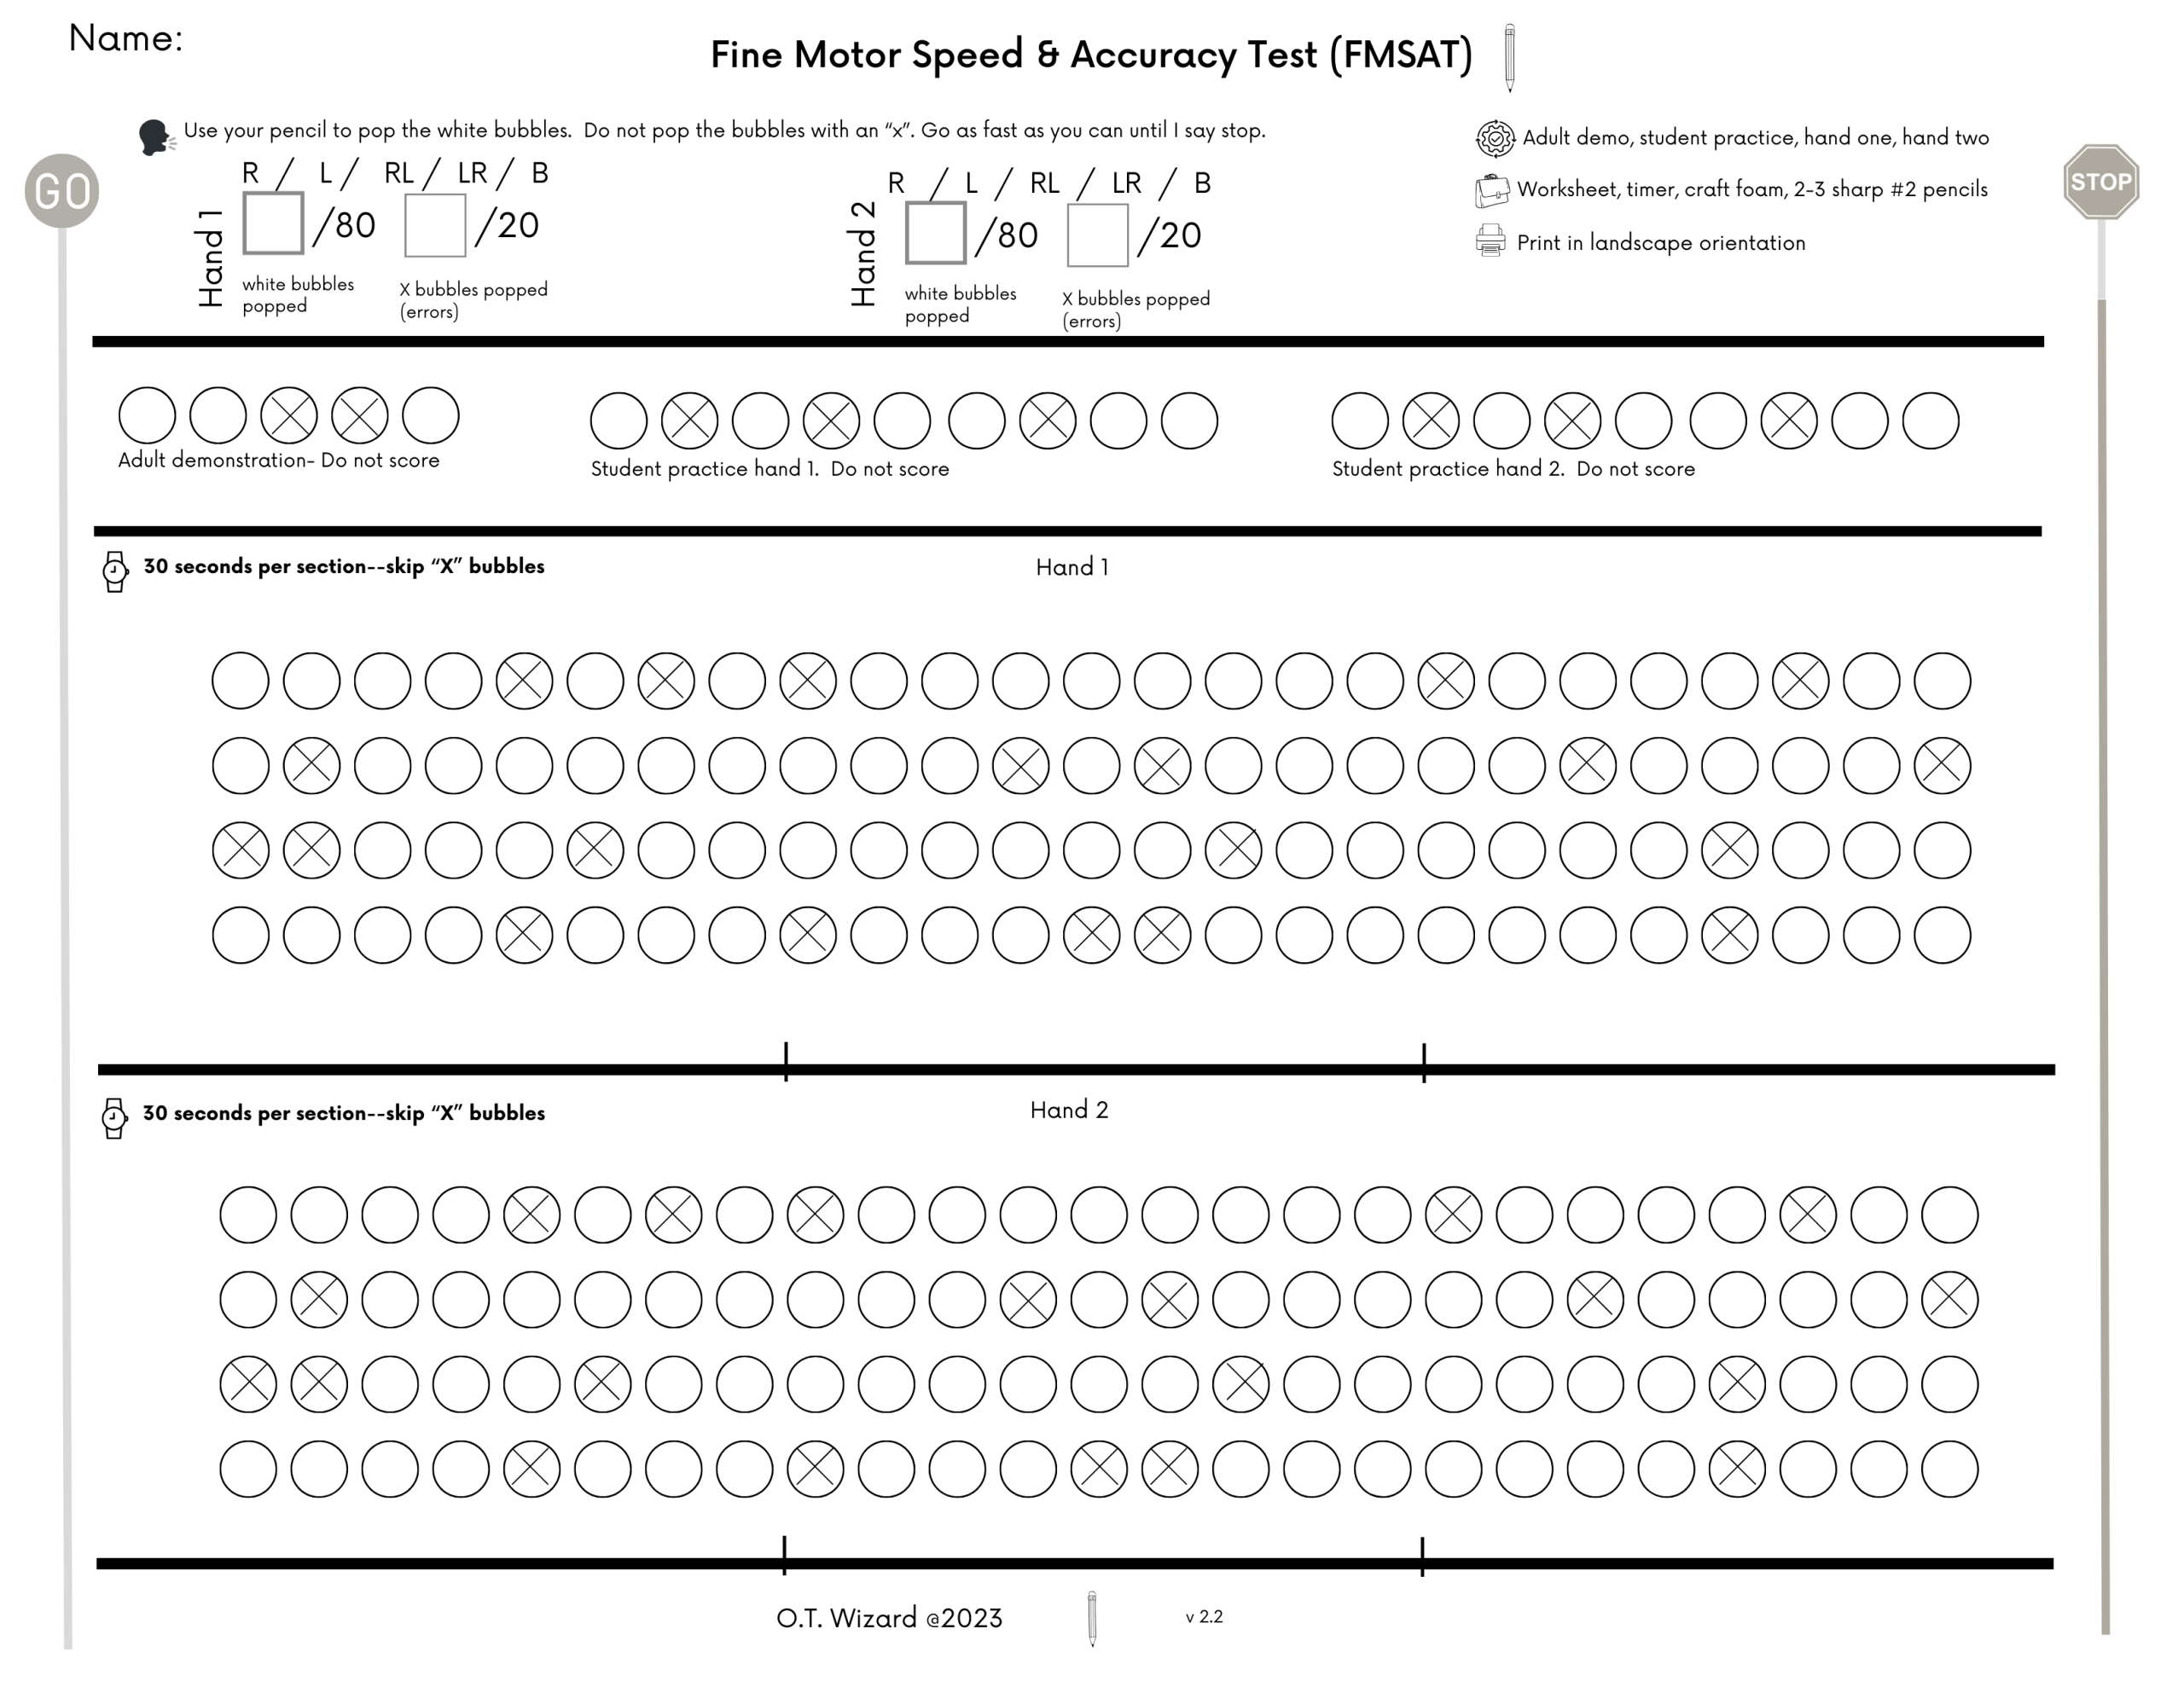



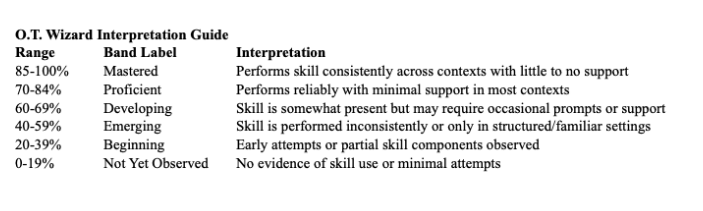





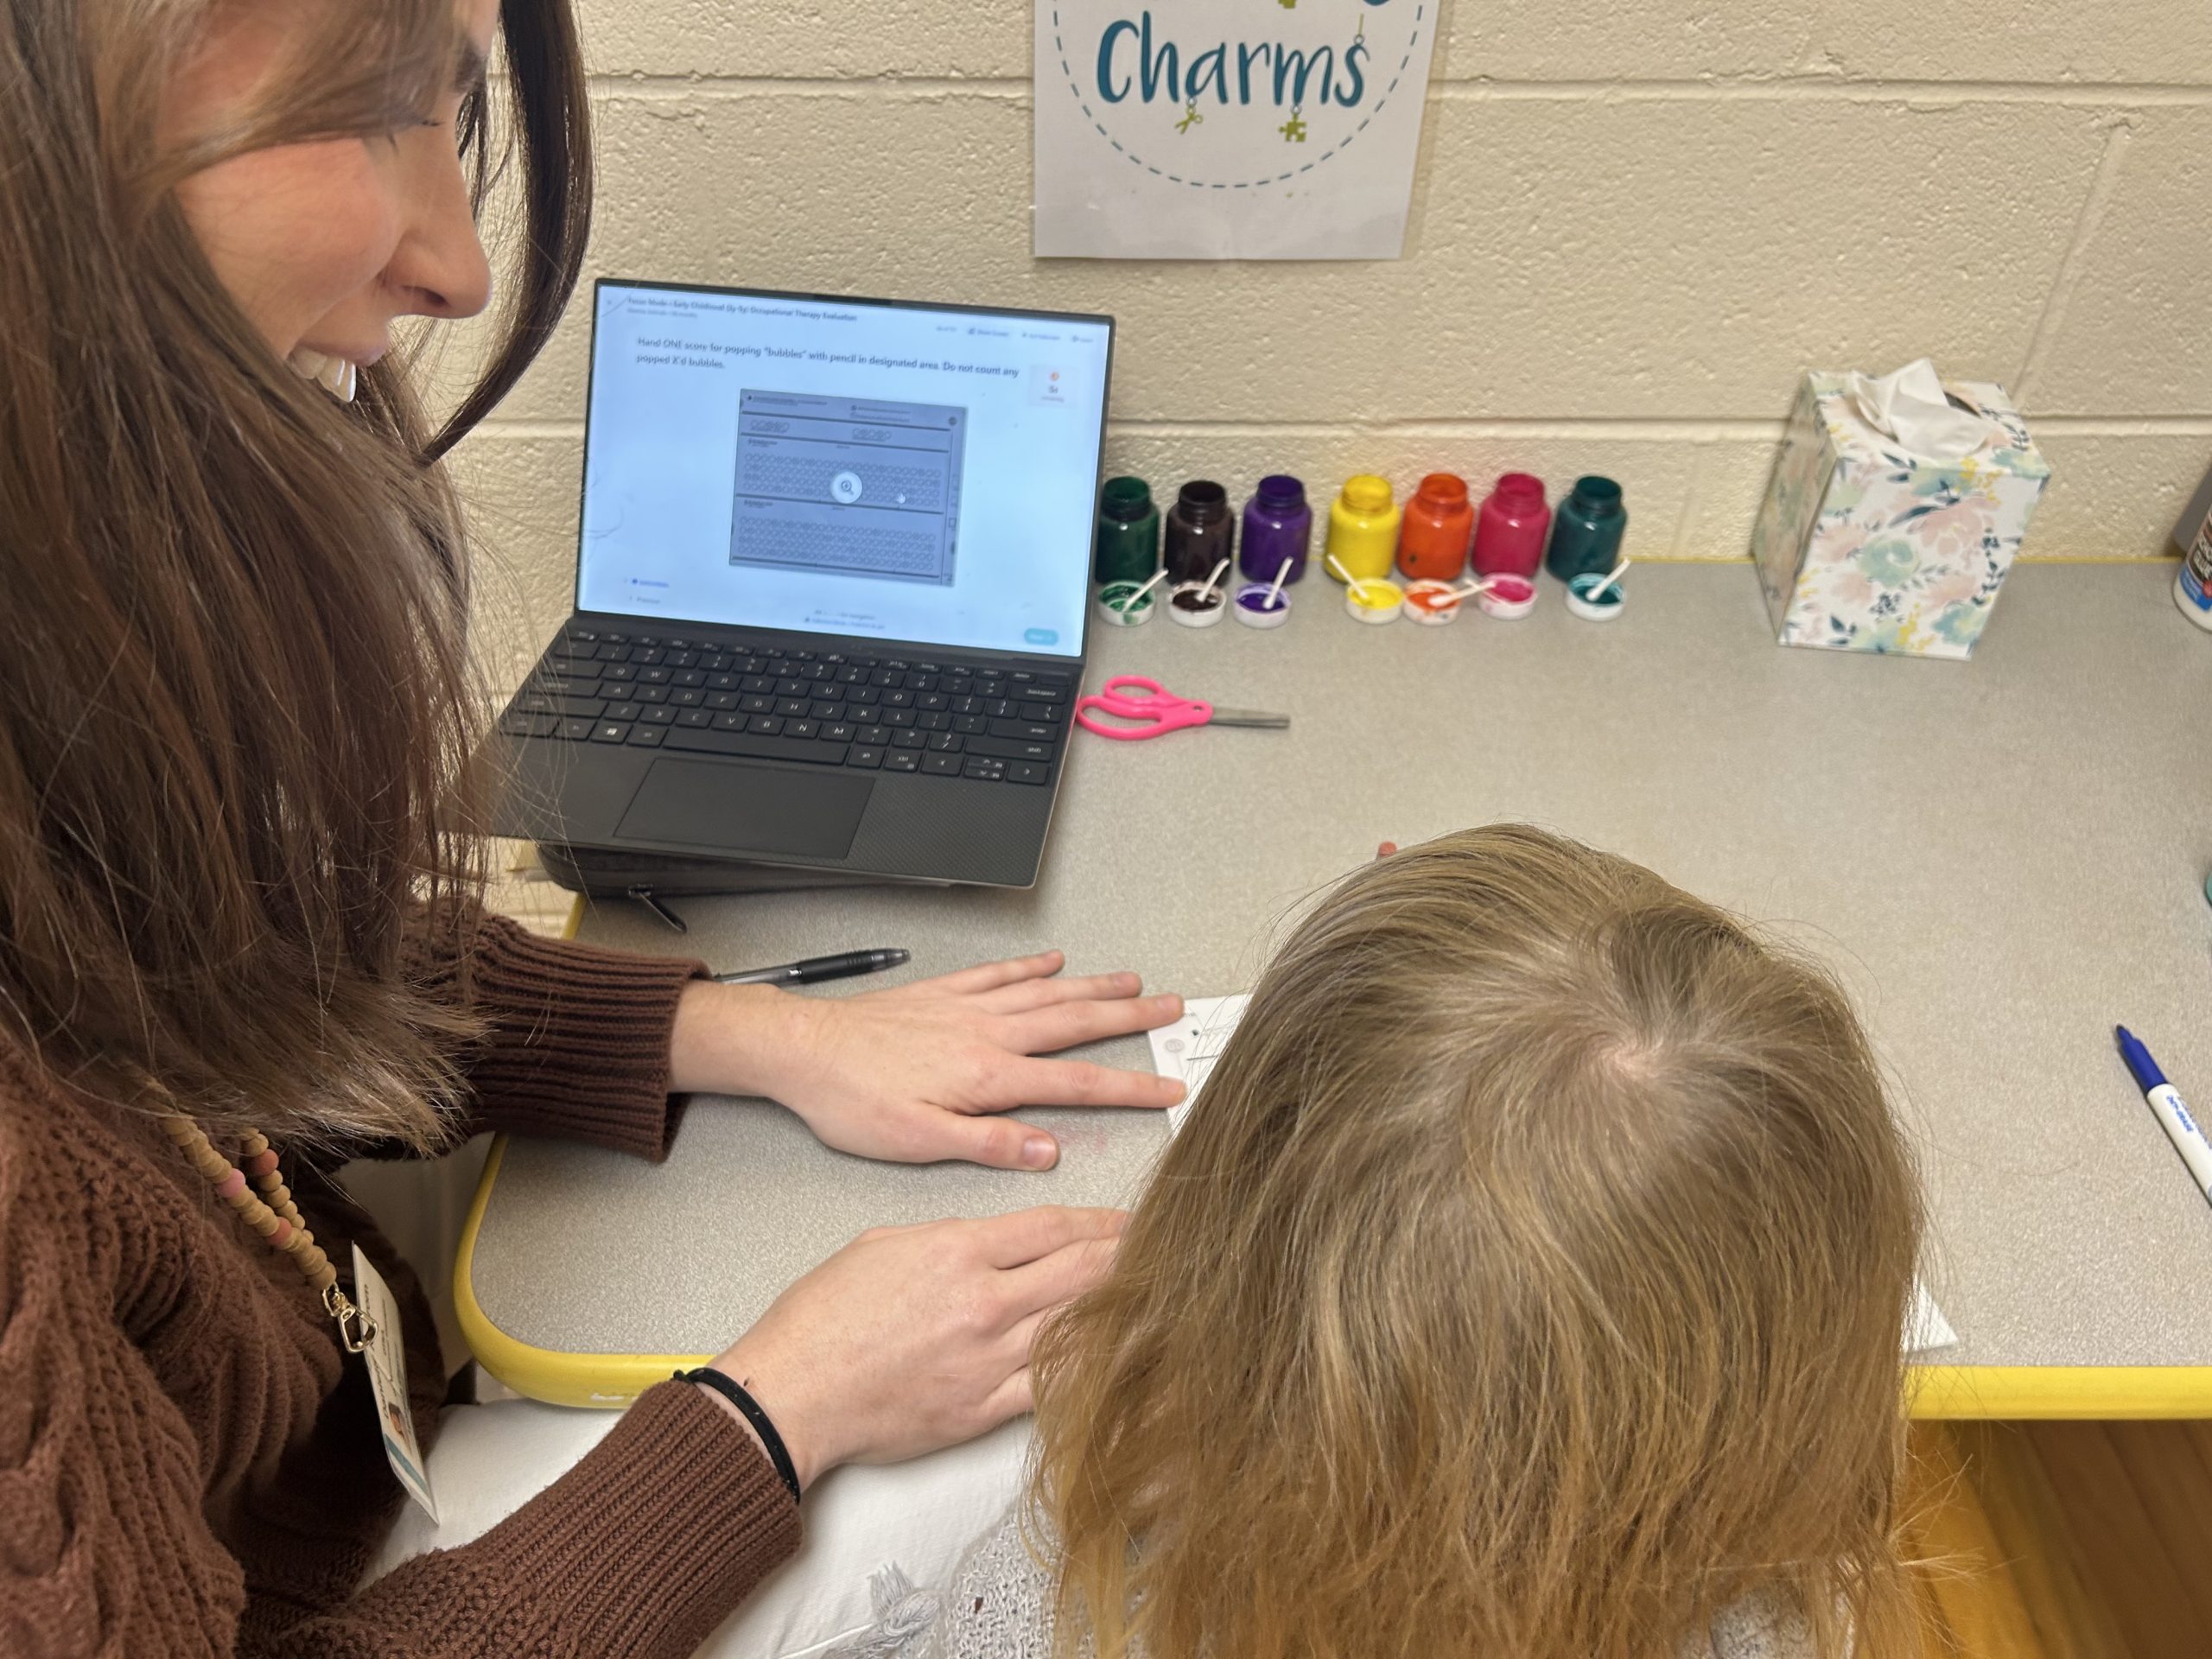
 Best-Performing Domains
 Thank you for building the future of evidence-based OT assessment with O.T. Wizard.