How 3.8 Years of Systematic Clinical Measurement Demonstrates That Occupational Therapy Works
Stephanie Seymore Wick, MSOT, OT/L | Founder and Clinical Architect, O.T. Wizard | Learning Charms, Inc., Charlotte, North Carolina
The Problem With Checklists
For years, occupational therapists working in early childhood settings were collecting data that told them almost nothing. Checklist-style evaluations produced a snapshot: present or absent, yes or no. They could not tell you whether a child improved. They could not tell you which counties had greater concentrations of developmental need. They could not tell you whether your team’s intervention was moving the needle or whether children were simply getting older.
That was the reality facing Learning Charms in 2022. We were screening and evaluating large numbers of children across Head Start programs, NC Pre-K classrooms, and community settings throughout North Carolina, and we had nothing meaningful to show for it in terms of trend data, geographic insight, or outcome evidence.
So I built something.
From Nothing to 8,509 Screenings and Evaluations
The FUNdamental Foundations (FF) screener was designed and developed by a managing pediatric occupational therapist with 25+years of clinical experience. It was built as a structured, multi-domain developmental tool designed from the outset to generate analyzable data. It was not designed for publication. It was designed to answer clinical questions: What does this population look like? Where are the gaps? Is what we are doing making a difference?
Thirty clinicians on the Learning Charms team tested and used each version in the field, providing the real-world feedback that drove every refinement. They made the transition from paper-and-pencil evaluations to digital data entry on a tablet or laptop, mid-session, with children in front of them. That is not a small ask. The early weeks required support with the technology. There were growing pains. The team did it anyway, and they did it without much, if any complaint.
The FF tool went through two versions, each refined based on team feedback. Version 6 ran from June 2022 through July 2023. Version 7, with improvements including date of birth capture and an updated item structure, ran from August 2023 through May 2025. In late 2025, the practice transitioned to O.T. Wizard, a fully rebuilt clinical intelligence platform designed and built by the same therapist. O.T. Wizard was built with Rasch psychometric architecture, 15 guided evaluations, and integrated outcome tracking across 12 domains.
The table below summarizes what 3.8 years of that effort produced.
Table 1. Clinical Data Collected Across the Full Evidence Ecosystem (2022-2026)
| Platform | Period | Records | Evaluations | Screenings | E1-E2 Pairs |
| FUNdamental Foundations V6 | Jun 2022 – Jul 2023 | 2,928 | 1,511 | 1,417 | 324 |
| FUNdamental Foundations V7 | Aug 2023 – May 2025 | 4,962 | 2,368 | 2,594 | 477 |
| O.T. Wizard | Sep 2025 – Mar 2026 | 619 | 619 | — | 97 |
| TOTAL | 3.8 years | 8,509 | 4,498 | 4,011 | 898 |
Note. E1-E2 pairs = children with two complete evaluations allowing pre-to-post comparison. FF V6 pairs are V6-only matches. FF V7 pairs include V7-only and cross-version (V6 E1 to V7 E2) matches. OTW pairs matched by Student_ID. pp = percentage points.
In total: 8,509 individual assessment records. 4,498 full evaluations. 4,011 developmental screenings. 898 pre-to-post evaluation pairs. Over 245,000 item-level data points. Collected by a single clinical team, through routine practice, over less than four years.
What the Data Shows: Gains That Exceed Maturation
The central question in any clinical outcome dataset without a randomized control group is this: how do you know the gains are from intervention and not just from children getting older?
We address this directly.
Using cross-sectional developmental data from our own E1 (Initial Evaluation) dataset, we calculated the expected rate of developmental growth per month for each skill area based on age alone. This gives us a maturation baseline specific to this population. We then compared that expected gain to the gains actually observed in children who received OT services between E1 and E2 (Re-evaluation), over a mean interval of 5.4 months.
The results are consistent across all three measured domains and across both independent datasets.
Table 2. Observed Gains vs. Expected Maturation Over Mean 5.4-Month Interval (FF n=801 pairs, OTW n=94 pairs)
| Item | FF Observed Gain | Expected (Maturation) | Ratio | OTW Observed Gain |
| Draw a Person (0-4 scale) | +1.24 pts | +0.39 pts | 3.2x | +1.06 pts |
| Functional Pencil Grasp | +25.3 pp | +9.7 pp | 2.6x | +27.7 pp |
| Finger Touching (54-mo milestone) | +20.3 pp | +11.7 pp | 1.7x | n/a |
| Cohen’s d (DAP) | 0.94 | — | — | 0.84 |
Note. Expected gain calculated from cross-sectional linear regression of E1 scores on age in months using the full FF evaluated dataset. pp = percentage points. Cohen’s d: 0.2 = small, 0.5 = medium, 0.8 = large effect. OTW finger touching item not directly comparable due to different item structure.
Draw a Person improved at 3.2 times the expected developmental rate in FF and 2.6 times in OTW. Functional pencil grasp improved at 2.6 times expected in FF and 3.1 times in OTW. These are not marginal differences from what maturation alone would predict. They are two to three times larger. And they replicate across an entirely independent dataset collected with a different tool, by the same team, with different children.
Why This Is Not Just Children Getting Older
If the gains above were driven primarily by maturation, we would expect children at all starting points to show similar improvement. A child who enters at score 0 would gain roughly as much as a child who enters at score 3, because age-related development does not care where you start.
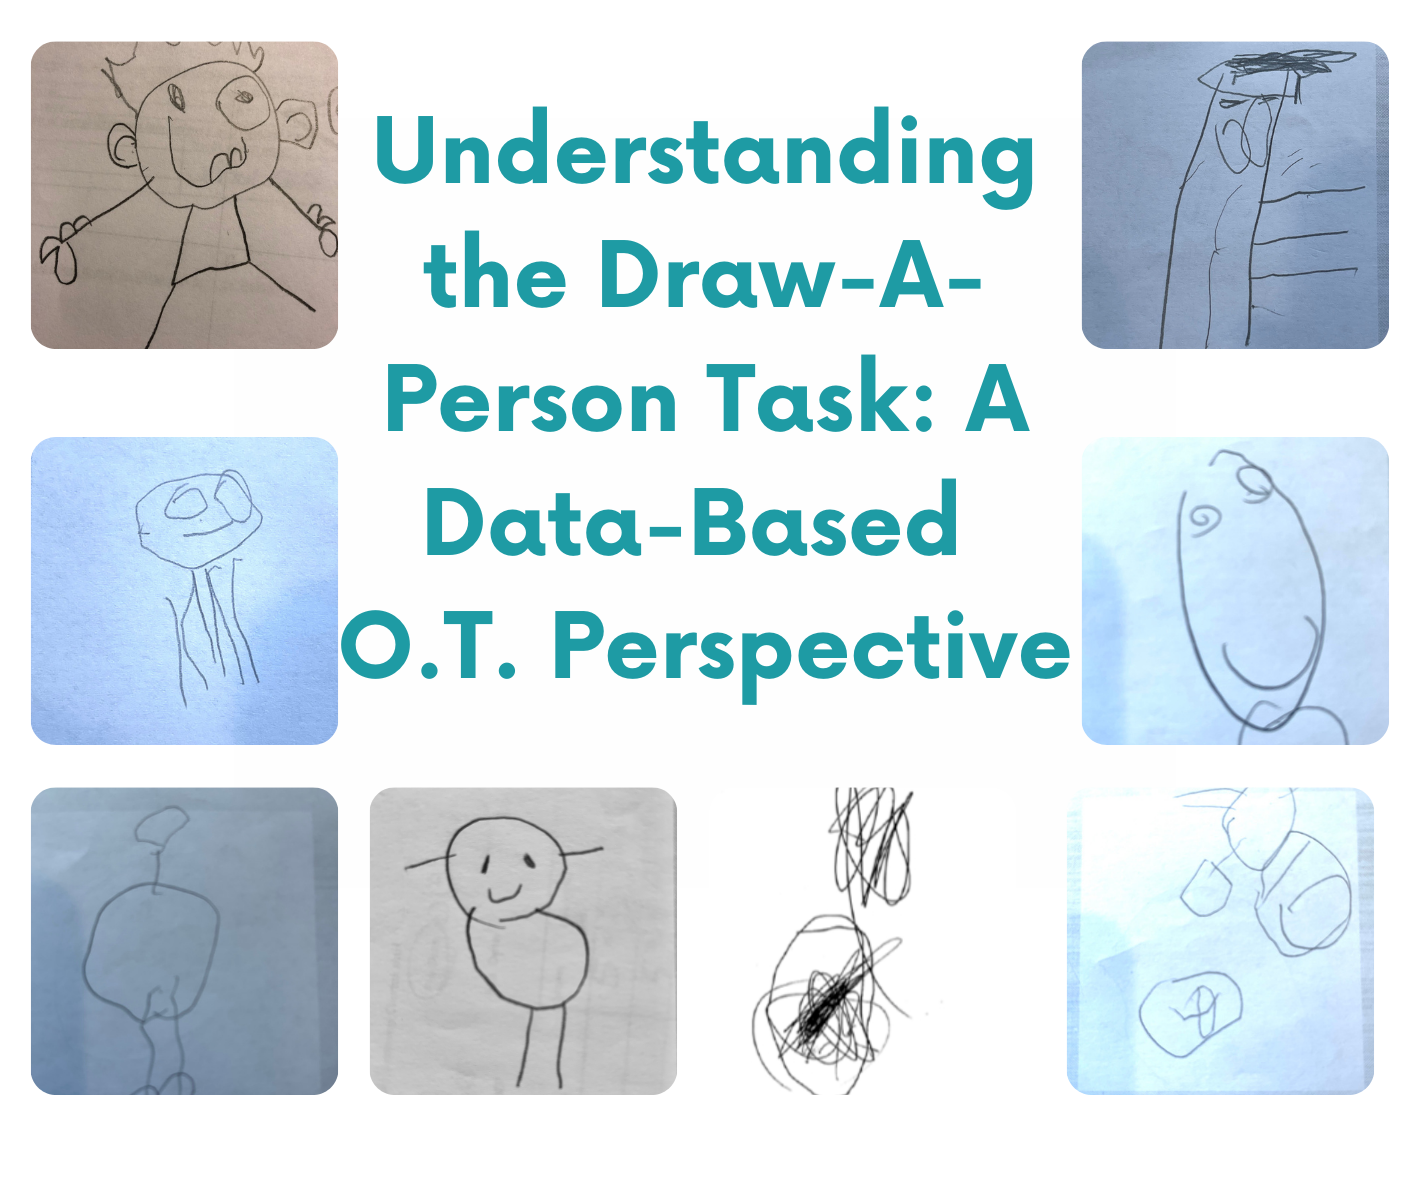
That is not what we see. The table below shows Draw a Person gains stratified by E1(Initial Evaluation) score, combining FF and O.T. Wizard data. The pattern is unambiguous.
Table 3. Draw a Person Gain by E1 Score: FF (n=801) + OTW (n=93) Combined
| E1 Score | n | E2 Mean | Mean Gain | % Improved | % Same | % Declined |
| 0 (no parts) | 365+29 | 1.74 | +1.74 | 74% | 26% | 0% |
| 1 (approximations) | 203+16 | 2.37 | +1.37 | 81% | 13% | 6% |
| 2 (head, no body) | 165+31 | 2.66 | +0.66 | 54% | 37% | 9% |
| 3 (recognizable) | 60+11 | 2.96 | -0.04 | 29% | 46% | 25% |
| 4 (6+ body parts) | 8+6 | 3.36 | -0.36 | 0% | 57% | 43% |
Note. n column shows FF count + OTW count at each E1 score level. E1 score 0 = no recognizable approximations. Score 4 = recognizable person with 6 or more body parts. Gains decline systematically as E1 score increases, reflecting ceiling effects at higher starting points rather than absence of progress.
Children who started at score 0 improved by an average of 1.74 points, with 74% showing measurable gains. Children who started at score 3 or 4 were near the ceiling of the scale and showed flat or slightly negative scores at E2, exactly as ceiling effects predict.
This score-dependent gain gradient is the signature of a real treatment effect. Maturation produces relatively uniform gains regardless of starting point. Intervention produces the largest gains in children with the most room to grow. That is what we observe, and it replicates point-for-point across both the FF and OTW datasets independently.
The grasp and finger touching data tell the same story from a different angle.
Table 4. Skill Transition Rates: What Happened Between E1 and E2
| Item | Status at E1 | n | Outcome at E2 |
| Pencil Grasp | Non-functional | 377 (FF) + 65 (OTW) | 60% converted to functional |
| Pencil Grasp | Functional | 417 (FF) + 29 (OTW) | 94% maintained functional |
| Finger Touching | Fail | 407 (FF) | 58% passed at E2 |
| Finger Touching | Pass | 394 (FF) | 82% maintained pass |
60% of children with non-functional pencil grasp at E1 had functional grasp by E2. 94% of children with functional grasp at E1 maintained it. Skills were not fluctuating randomly. They were moving in one direction and holding. That is not maturation. That is intervention.
Two Tools, Three Years Apart, Same Answer
The FF screener and O.T. Wizard are different instruments. FF was a clinician-developed Google Form with embedded scoring anchors and standardized stimulus materials. O.T. Wizard is a fully architected clinical platform undergoing Rasch psychometric validation, with 596 data variables per evaluation and item-level calibration. The two tools share several core items, including Draw a Person, pencil grasp classification, and finger touching. They do not share overlapping children. The DAP scale is directly comparable across both tools at the 0 to 4 range, with identical scoring anchors at each level. O.T. Wizard extended the ceiling by adding two higher-level descriptors, bringing the OTW scale to 6 points total. For this analysis, OTW DAP scores were capped at 4 to ensure a valid cross-tool comparison.
Yet when we calculate the cross-sectional developmental growth rate for Draw a Person from FF E1 data, we get 0.072 points per month. From OTW E1 data, we get 0.082 points per month. Two tools, thousands of children, the same underlying developmental trajectory captured within 0.01 points of each other per month.
When two independent measurement systems produce convergent developmental slopes and convergent gain ratios, that is not a coincidence. That is construct validity. Each dataset serves as an independent replication of the other’s findings, and both point to the same conclusion.

What This Means for OT Practice and Clinical Infrastructure
Pediatric occupational therapists have long known that their interventions make a difference. The challenge has been demonstrating it systematically, at scale, in a form that partners, funders, schools, and insurance providers find credible.
The Learning Charms team built that demonstration over 3.8 years, starting from scratch, with no research funding, no university partnership, and no IRB. They built it by replacing meaningless checklists with structured clinical measurement, by training a team of 30 clinicians to collect data consistently, and by iterating their tools until the data was worth analyzing.
O.T. Wizard is the current iteration of that infrastructure. It is not a platform claiming efficacy. It is a platform whose evidence base already exists, built by the same team that built the platform, using the same children, in the same communities, over the same years. The data in this paper is not a promise of what O.T. Wizard will eventually show. It is a record of what systematic clinical measurement has already demonstrated.
OT works. The data, replicated across tools and years and nearly 900 pairs of children, shows it.
Disclosure
Stephanie Seymore Wick is the founder and clinical architect of O.T. Wizard and owner of Learning Charms, Inc. All data was collected through routine clinical practice and contracted screening partnerships. No external funding was received. The FUNdamental Foundations screener was a clinician-developed field tool and has not undergone formal psychometric validation. O.T. Wizard is currently undergoing Rasch analysis validation. All findings should be interpreted as practice-based clinical evidence rather than results from a randomized controlled trial.
About O.T. Wizard
O.T. Wizard is a clinical intelligence system for pediatric occupational therapy professionals. The platform supports evaluation, documentation, goal planning, and scheduling across 12 domains including fine motor skills, visual-motor integration, praxis, visual perception, executive functioning, activities of daily living, and participation. O.T. Wizard is undergoing Rasch analysis validation to establish psychometrically sound, norm-referenced scoring with living norms that update as the clinical database expands. Learn more at otwizard.com.
About Learning Charms
Learning Charms is a pediatric occupational therapy group that employs roughly 25 OTP’s in the Charlotte , NC and surrounding counties. Learning Charms is now focused mainly on preschool aged children in their school environment.