Author: Stephanie Wick, OT/L, MSOT

  • Why OTP’s need better assessments-update on the FMSAT

    Why OTP’s need better assessments-update on the FMSAT

    Measuring Neuromotor Lateralization Across the Lifespan: Progress on the FMSAT Norming Project (& Why OTP’s need better assessments)

    How a one-minute screener for hand dominance, modern Rasch psychometrics, and the shift to value-based care are converging to change how occupational therapists, educators, and clinicians measure what we do.

    Published May 24, 2026 by Stephanie Seymore Wick, MSOT, OT/L · Founder, Learning Charms and O.T. Wizard

    A short progress note before we go deeper

    Every week I send out an update to the therapists, educators, and clinicians contributing to the FMSAT norming project. The updates focus on data, leaderboards, and the age bands we still need to fill. This week the data deserves a deeper look than a weekly email can carry. The findings touch on questions that go well beyond a single screener, including how our profession measures what we do, how those measurements connect to insurance reimbursement, and why occupational therapy salaries have not kept pace with the cost of becoming an OT.

    If you are a pediatric occupational therapist who has ever had to defend a Beery score at an IEP meeting that did not match the child sitting in front of you, this post is for you. If you are an educator looking for a fast, fair screening tool to identify students who may benefit from earlier support, this is for you. If you are an adult-focused OT, a neurology specialist, or a clinician working with progressive motor conditions, this is for you too. And if you are an OT, OTA, or therapy leader thinking about the coming shift to value-based care and what it means for your practice, this is also for you.

    Here is what is in this post:

    • What the FMSAT is, what it actually measures, and why it works across the lifespan
    • How the FMSAT can be used as a one-time screener, a progress monitoring tool, and a lifelong tracking instrument
    • What Rasch analysis is, in plain English, and why it is considered the gold standard in modern assessment
    • The first Rasch results on the FMPRS, our companion rating scale
    • What ecological validity means and why your favorite assessments may be missing it
    • Why the FMSAT itself uses Classical Test Theory and the FMPRS uses Rasch
    • Why value-based care is about to make all of this matter more than it ever has before
    • How the O.T. Wizard platform, soon to be rebranded as MyTherapyWizard, fits into the bigger picture

    A note on terminology before we go further

    Throughout this post you will see three terms that are sometimes used interchangeably but mean different things in occupational therapy practice and in psychometrics. Getting the distinction right matters because the FMSAT is one of those terms and not the others.

    A screener is a brief, low-burden tool designed to flag people who may benefit from further evaluation. Screeners take a minute or two, can often be administered by people without specialized clinical training, and produce a simple signal that says proceed to next step or no further action needed. Screeners do not diagnose, do not establish eligibility, and do not produce a comprehensive clinical picture. Examples in healthcare include the M-CHAT for autism, the PHQ-9 for depression, and vision and hearing screens in schools.

    An assessment is a more comprehensive structured evaluation that produces detailed information sufficient to support diagnosis, eligibility decisions, and treatment planning. Assessments typically take 30 to 90 minutes, require trained administrators, and produce multiple subscores or domain scores. Examples in pediatric OT include the Beery-Buktenica Developmental Test of Visual-Motor Integration, the Peabody Developmental Motor Scales, the Bruininks-Oseretsky Test of Motor Proficiency, the Sensory Processing Measure, and the Pediatric Evaluation of Disability Inventory Computer Adaptive Test (PediCAT).

    An evaluation is the broader clinical process that uses one or more screeners and assessments together with observation, interview, and chart review to produce a full clinical picture and recommendations.

    The FMSAT (Fine Motor Speed and Accuracy Test) is a screener. It is not designed to replace any assessment in your toolkit. It is designed to do the screener job well, which means flagging test takers who may benefit from a comprehensive evaluation when their lateralization or fine motor speed scores fall outside expected ranges. The assessments that follow a positive FMSAT screen will be whatever your clinical reasoning and your setting indicate. The point of a good screener is to make sure the right people get to those assessments faster than they would have otherwise.

    The FMPRS (Fine Motor Participation Rating Scale), on the other hand, is functioning more like a brief assessment instrument during the validation phase of this project, because its job is to produce the multi-domain rating data needed to establish ecological validity for the FMSAT. After validation is complete, the FMPRS will not typically be used alongside the FMSAT in routine clinical screening.

    What the FMSAT measures and why it works across the lifespan

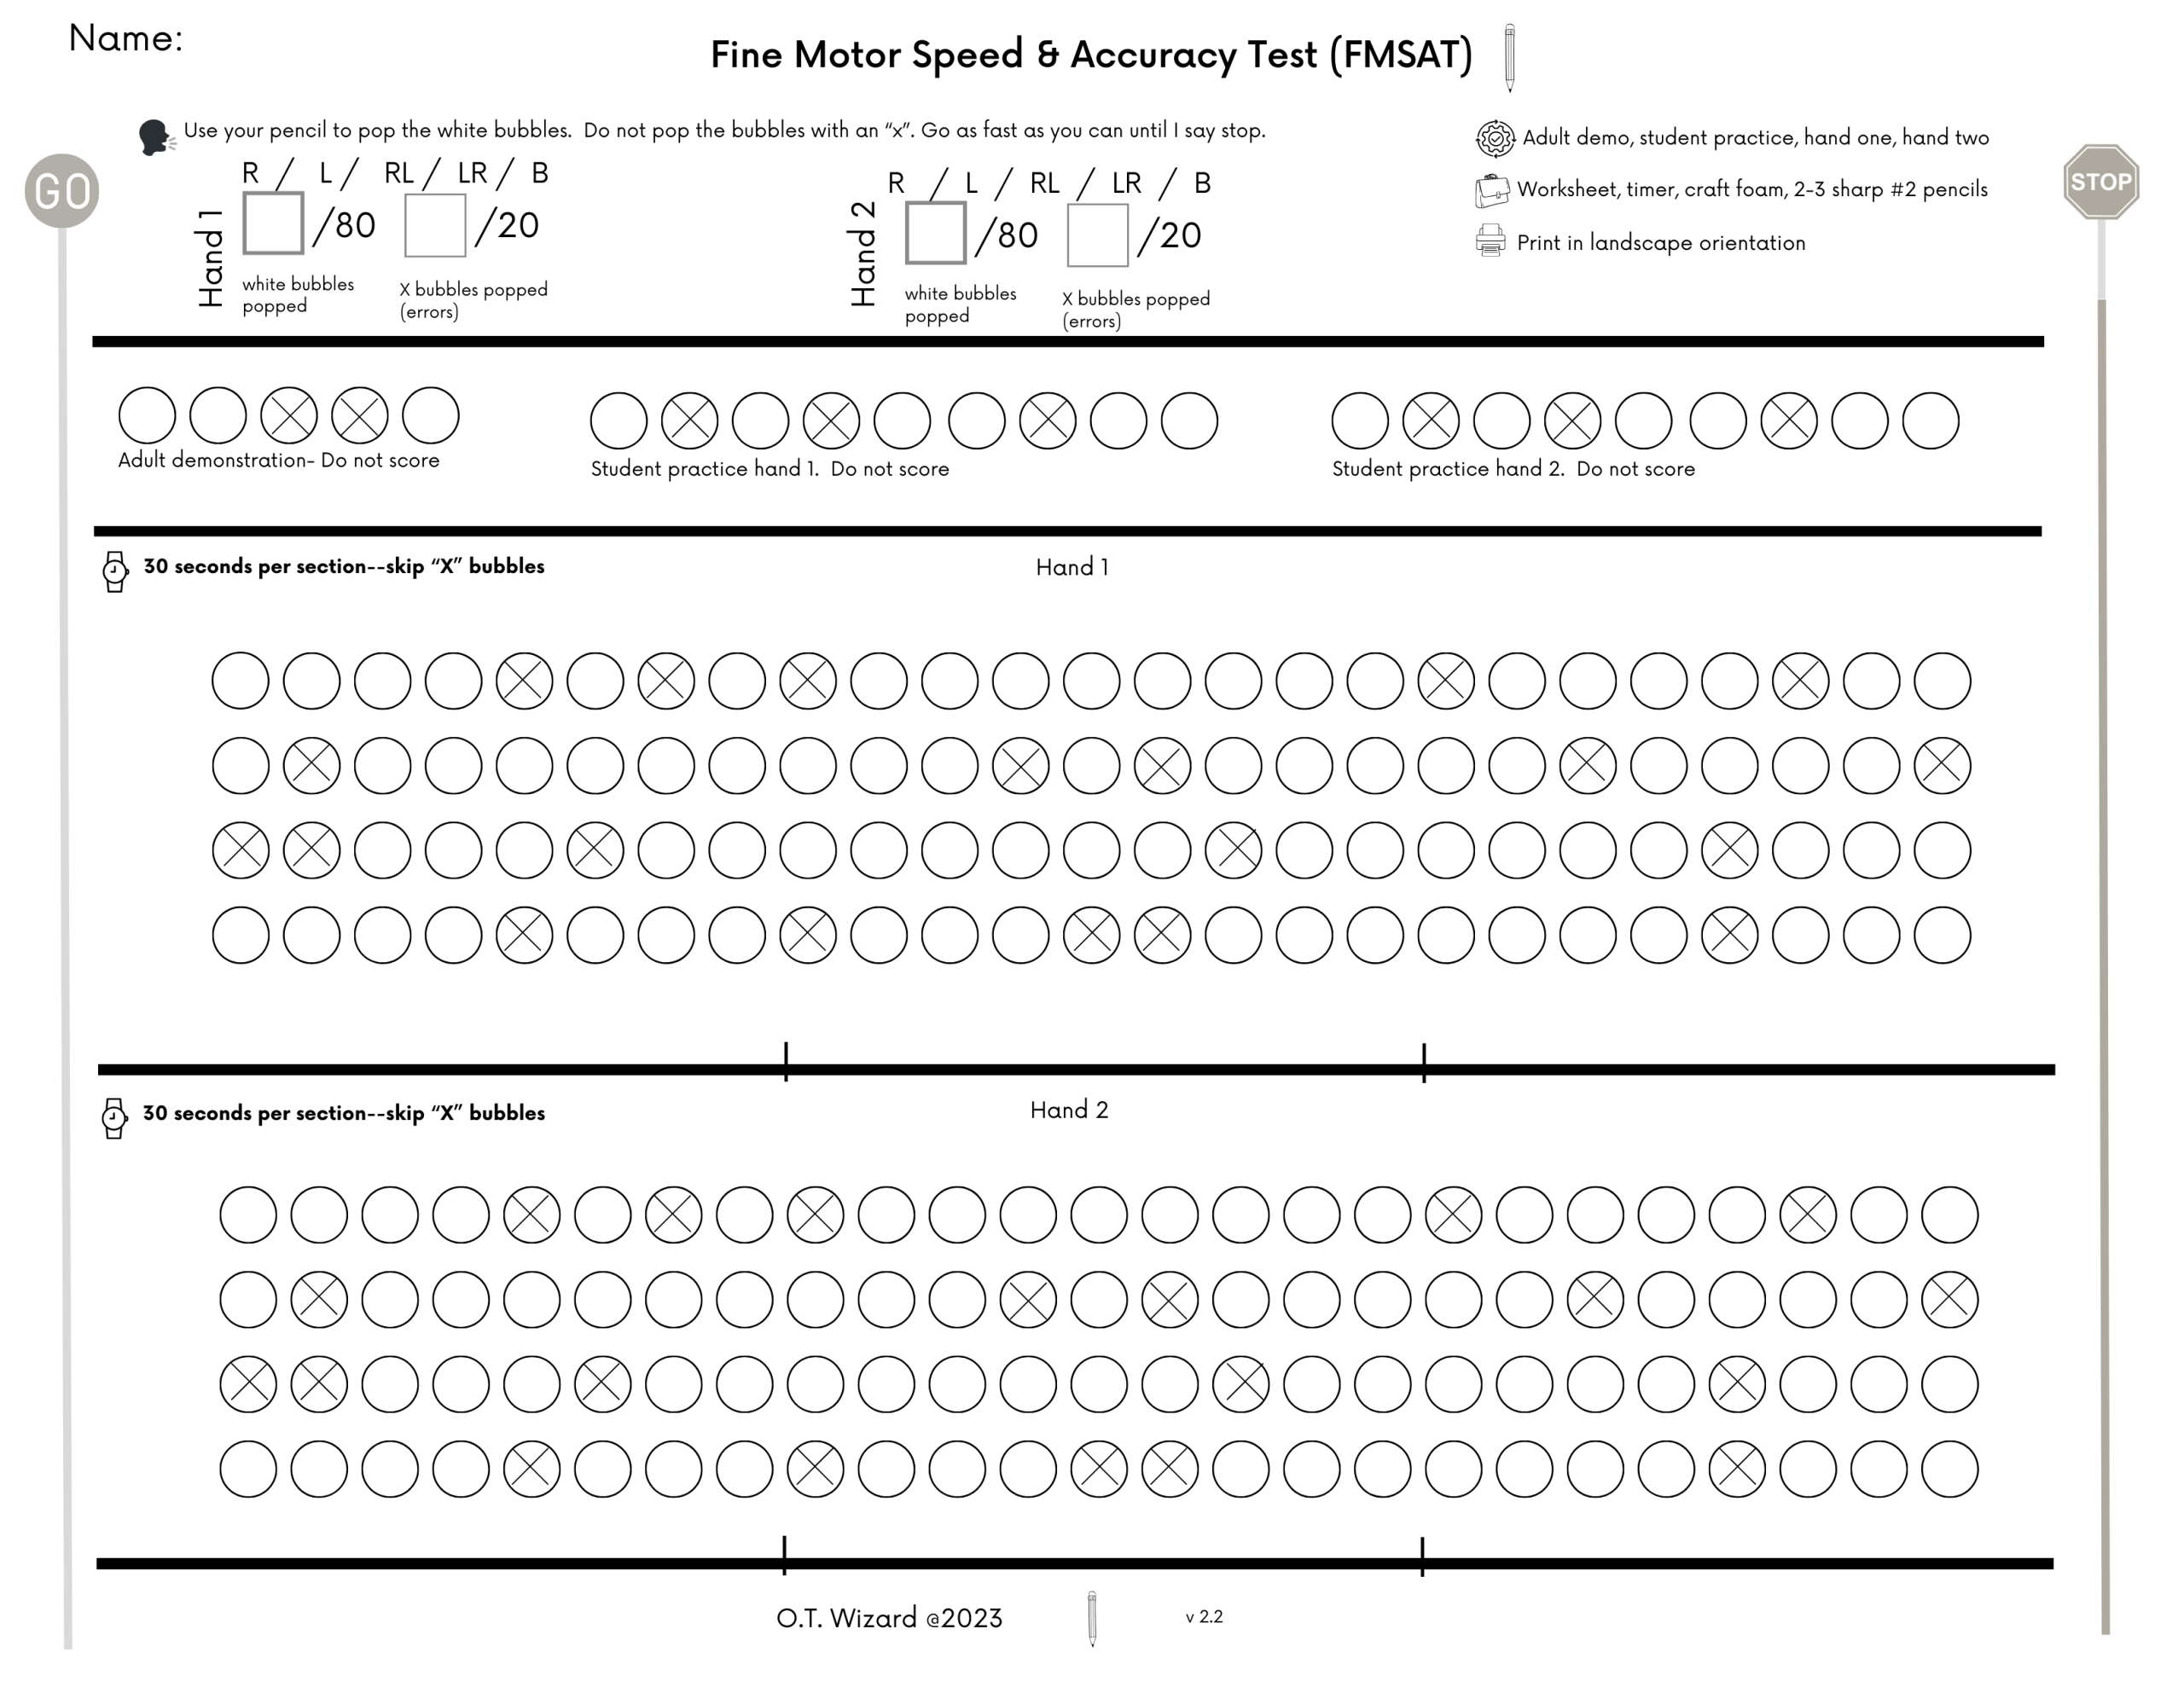
    The FMSAT, which stands for Fine Motor Speed and Accuracy Test, is a one-minute screener. The test taker is given a bubble-popping worksheet and asked to pop as many bubbles as they can in 30 seconds with one hand, then 30 seconds with the other hand. The score for each hand is the number of bubbles popped. That is it. No rater training, no expensive test kits, no proprietary materials beyond a printed worksheet.

    The name says fine motor speed and accuracy, and that is what each hand score reflects. But the construct the instrument was designed to measure, and the reason the two hands are tested separately, is neuromotor lateralization. Lateralization is the degree to which a person has committed one side of the brain, and therefore one hand, to specialized motor work. Strong lateralization means the dominant hand performs precision tasks fluently while the non-dominant hand serves as a stabilizer. Weak or absent lateralization means the two hands perform more similarly, hand preference is inconsistent, or the person switches hands mid-task. Fine motor speed is the metric we use to detect that pattern, because timed performance under demand reveals the lateralization signal more clearly than untimed observation does.

    This matters because lateralization is not just a developmental milestone of early childhood. It is a lifelong neuromotor property that emerges during the preschool years, consolidates through school age, holds through adulthood, and can shift or erode in response to neurological changes later in life. The FMSAT was designed to capture that lateralization signal at any age, which is why our normative dataset spans from preschool through older adulthood rather than stopping at age 12 or 17.

    What makes the FMSAT useful is not the bubble popping itself. It is what the two hand scores together tell us about how well a person has consolidated hand dominance, and how that pattern compares to typical lateralization for their age. The dominant hand score reflects fine motor capability. The difference between the two hands reflects lateralization. Both pieces of information matter for clinical and educational practice, and neither one is captured well by the standardized assessments most occupational therapists currently use.

    How the FMSAT can be used: one-time screener, progress monitoring, and lifelong tracking

    Because the FMSAT is fast, standardized, and produces a numeric score, it can support several clinical and educational use cases that most current assessments cannot. Three are worth naming explicitly.

    Use case 1: One-time screening for hand dominance and fine motor concerns

    This is the most familiar use case. A pediatric occupational therapist, school OT, or educator administers the FMSAT to a student who has been flagged for fine motor concerns, handwriting difficulty, or unclear hand dominance. The score, compared to age-appropriate normative bands, gives a quick objective marker of whether the student’s performance and lateralization fall within expected ranges. This is the use case the validation manuscript will focus on first.

    Use case 2: Response to Intervention and progress monitoring

    Because the FMSAT takes one minute and produces a numeric score, it can be re-administered at intervals to track whether a person is making measurable progress over time. This is exactly the kind of brief repeatable measurement that Response to Intervention frameworks and Multi-Tiered Systems of Support models require. A school OT could administer the FMSAT at the start of an intervention block, midway through, and at the end, and have objective data showing whether the lateralization or fine motor speed measure is changing in response to the intervention. A clinic-based OT could do the same across a course of therapy. The same minimum-detectable-change thresholds that value-based payment models are increasingly requiring would apply directly. Once the normative dataset is finalized, the FMSAT becomes one of the few fine motor measures fast enough to use for routine progress monitoring.

    Use case 3: Educator-administered screening in school settings

    The FMSAT requires no rater training and no clinical interpretation to administer. A teacher, paraprofessional, school nurse, or interventionist can give the test and record the scores. With enough normative data in place, the score itself does the screening work and a teacher does not need to be an OT to identify a student who falls below the expected band. This opens the door to universal screening at the classroom or grade level, the same way schools currently screen vision and hearing. Students flagged by the screener can then be referred to occupational therapy for full evaluation. This is a long-term vision rather than an immediate use case, but it is exactly the kind of MTSS Tier 1 screening application that schools have been asking for and that occupational therapy has not yet had the tools to support.

    Use case 4: Lifespan monitoring, including progressive neuromotor conditions

    This is the use case that emerges directly from norming the FMSAT across all ages rather than only in pediatrics. Lateralization can shift across the lifespan in response to neurological events and conditions. A person recovering from stroke may show changed dominant-hand performance. A person living with multiple sclerosis, Parkinson’s disease, or another progressive neuromotor condition may show gradual erosion of the lateralization signal as the condition advances. A person experiencing age-related changes in motor control may show compression of the dominant-hand advantage. The FMSAT, administered periodically, could detect those shifts earlier and more objectively than self-report or general clinical observation. With enough normative data across all ages, the same one-minute test that screens a five-year-old for emerging hand dominance could monitor a 55-year-old neurologist for early signs of motor change in the years after a diagnosis. That is the broader clinical reach the lifespan normative dataset makes possible.

    None of these use cases require a separate test. They all use the same one-minute bubble-popping task. What changes is who is administering it, how often, and what the score is being compared against. That flexibility is one of the reasons we are investing in the validation work the way we are.

    What is Rasch analysis and why is it considered the gold standard?

    Many occupational therapy assessments you have used in your career, including those most commonly used to demonstrate progress in pediatric settings, were developed using Classical Test Theory, often shortened to CTT. The Beery-Buktenica Developmental Test of Visual-Motor Integration, the Bruininks-Oseretsky Test of Motor Proficiency, the Peabody Developmental Motor Scales, and the Sensory Processing Measure are CTT-based instruments. CTT produces a total score that is then compared to a normative sample. The score tells you where a test taker falls relative to peers, but it has some real limitations.

    The biggest limitation is that CTT treats every item on a test as if it were equally difficult, and every point on the score scale as if it represented the same amount of skill. A test taker who scores 84 versus one who scores 89 may differ by a meaningful amount of skill, or may differ by almost nothing, depending on where on the scale those scores fall and which specific items they got right. CTT cannot tell you which.

    This is true for both screeners and assessments built under CTT, though the limitation is more consequential for assessments because assessments are doing more of the clinical decision-making work. A screener producing a CTT score is still useful as a yes/maybe/no signal. An assessment producing CTT scores is being asked to support diagnosis, eligibility, and treatment planning decisions on the same imprecise measurement scale.

    Rasch analysis, developed by Danish mathematician Georg Rasch in the 1960s, takes a fundamentally different approach. Rasch places each test item and each person on the same interval scale, called the logit scale. This means the distance between a score of 5 logits and 10 logits represents the same amount of skill change as the distance between 20 and 25. Rasch also calibrates each item individually, telling you which items are easy, which are hard, and whether each item is actually pulling its weight in measuring the construct.

    Rasch is to assessment what a ruler is to measurement. CTT scores tell you a child is somewhere in the middle. Rasch scores tell you exactly where, on a scale where the units are equal.

    Rasch analysis is considered the gold standard for modern instrument development because it is the framework used by some of the most respected and most defensible pediatric assessments in the field. The PEDI-CAT, the AMPS or Assessment of Motor and Process Skills, the School Function Assessment, and the WeeFIM are all Rasch-based or Item Response Theory based instruments. These are the tools that produce data insurance companies and researchers trust. If you have ever wondered why some assessments seem to have stronger research backing than others, the framework behind them is usually a big part of the answer.

    Behind the scenes: the first Rasch checkup on the FMPRS

    The FMPRS, or Fine Motor Participation Rating Scale, is the 12-item observer-rated companion to the FMSAT. It captures four dimensions of fine motor function across real-world tasks: fine motor speed, fine motor precision, laterality and bilateral differentiation, and participation in daily roles. Our Rasch consultant, Angie, ran the first calibration on 139 paired FMSAT and FMPRS records earlier this month. The results were strong for a first calibration on a relatively small sample.

    Finding one: the item difficulty order matches the developmental theory

    Rasch ordered the 12 items from easiest to hardest based on how raters actually responded to them. The Laterality items, which ask about hand dominance and bilateral hand use, came out as the easiest. The Participation items, which ask about sustained engagement in fine motor tasks throughout the day, came out as the hardest. This is exactly what we would predict developmentally. Hand dominance consolidates earlier in childhood than sustained occupational engagement, so on a rating scale measuring fine motor function across the developmental arc, laterality items should be easier to endorse than participation items. The data confirmed the theory.

    Finding two: the instrument separates clinical and typical test takers cleanly

    On the Rasch-derived person measure, typical preschoolers scored more than two logits higher than clinical preschoolers. In plain terms, the typical preschooler scored higher than approximately 98 percent of the clinical sample. This is what is called a known-groups validity effect, and a Cohen’s d effect size above 2.0 is unusually strong. Most pediatric assessments are pleased to show known-groups effects in the 0.5 to 0.8 range. The FMPRS is producing separation that is roughly three times stronger. As the normative dataset grows beyond preschool ages, we expect the same separation pattern to extend across older age bands and into adult populations where clinical and typical comparison groups can be defined.

    Finding three: the FMPRS and the FMSAT are picking up the same underlying construct

    The Rasch-derived person measure on the FMPRS correlated with FMSAT dominant hand scores at r = 0.575. That correlation tells us that two completely different methods of measurement, a one-minute performance task and a 12-item observer rating scale, are picking up the same underlying construct. This is exactly the kind of cross-method convergence a strong validation manuscript needs.

    What still needs work

    Five items in the FMPRS came back as overfitting in the Rasch model, which means they are too internally redundant. They are not bad items. They are just not adding as much new information as they could. Those items will be revised for the next version of the FMPRS based on what the calibration showed us. This kind of iterative refinement is how serious instrument development works, and it is exactly why we are doing this calibration now, before the manuscript is finalized.

    Ever wondered why Beery, PDMS-3, or BOT-2 scores do not match real-world function?

    Here is a question every occupational therapist has wrestled with at some point in their career. Why do scores from the Beery-Buktenica VMI, the Peabody Developmental Motor Scales, or the Bruininks-Oseretsky Test sometimes fail to line up with what you actually see in the classroom, at home, on the playground, or in adult daily life?

    You are not imagining it. A student can score below average on a tabletop visual motor task and still write legibly, manage their lunchbox, and participate fully in PE. Another can score in the average range and still struggle every single day to keep up with handwriting demands or self-care routines. The same pattern shows up in adult assessments. The mismatch is real, and it has a name in the psychometric literature. It is called an ecological validity gap.

    What ecological validity actually means

    Ecological validity is a psychometric term that answers a simple question: does this assessment measure something that actually matters in real life? An instrument with strong ecological validity produces scores that connect to how a person functions in their daily environment. An instrument with weak ecological validity produces scores that connect mainly to how a person performs on the test itself, with limited evidence that the score predicts daily function.

    Many of the assessments OTs use most often were designed to measure isolated motor performance, not real-world participation. They are good at what they measure. They were just never built to answer the participation question. When a school-based therapist is asked to defend a Beery standard score at an IEP meeting, or when a clinic-based therapist is asked to justify medical necessity to an insurer using a PDMS-3 score, the underlying problem is often that the score is being asked to do something the assessment was not designed to do.

    Why the FMPRS is essential to FMSAT validation, even though clinicians will not use both in practice

    Here is a question that comes up almost every time I explain this project. If the FMSAT is a screener, why pair it with the FMPRS at all? Won’t clinicians be expected to do both?

    The answer is no. The FMPRS is doing critical work right now, during validation, so that the FMSAT will not need to be paired with it in clinical practice later. The whole value of the FMSAT as a screener depends on it being a one-minute, paper-and-pencil, standalone score. Asking clinicians to also complete a 12-item rating scale every time they administered the screener would defeat the entire point of having a screener in the first place.

    What the validation work establishes, and what every paired FMSAT and FMPRS submission helps establish, is that when the FMSAT score is elevated or compressed in a particular way, it is reflecting something that shows up in the test taker’s real-world functional life. Once that link is established and published in a peer-reviewed manuscript, the FMSAT score on its own carries that ecological meaning forward. Clinicians using the FMSAT in practice will be able to point to the published validation evidence rather than having to demonstrate the connection every time.

    This is the same approach used to validate other widely accepted screeners. The Modified Checklist for Autism in Toddlers, known as the M-CHAT, was validated against full ADOS and ADI-R diagnostic batteries. Pediatricians using the M-CHAT today do not run an ADOS alongside it. The validation work was done once and the screener now stands on its own. The PHQ-9 depression screener was validated against structured psychiatric interviews. Primary care providers use it on its own today. The pattern is consistent across well-validated screeners. Validate against a richer companion measure once, publish the validity evidence, then use the screener on its own.

    Why the FMSAT itself uses Classical Test Theory and the FMPRS uses Rasch

    This is a question that any sharp reader will be asking by now. If Rasch is the gold standard, why is the FMSAT being calibrated using Classical Test Theory rather than Rasch?

    The answer comes down to the measurement structure of each instrument. The FMSAT produces raw bubble counts on a zero to 80 scale for each hand. That kind of continuous count data is well-suited to CTT-style descriptive statistics, percentile norms, and known-groups validity comparisons. These are the analyses the FMSAT validation manuscript will lean on, and they are the analyses that produce the percentile bands and severity cutoffs clinicians actually use at the point of care.

    Rasch is the right framework for the FMPRS because the FMPRS uses ordered category responses on a four-point scale, and each item can be at a different difficulty level on the same underlying trait. That is exactly the kind of measurement structure Rasch was designed to handle. The two instruments are built differently on purpose, and each one is being analyzed using the framework that fits its measurement structure.

    The Rasch work on the FMPRS gives the manuscript the modern psychometric backbone peer reviewers expect. The CTT work on the FMSAT keeps the screener simple and interpretable for the clinicians who will actually use it. Both pieces matter, and together they create a defensible validation argument.

    Why value-based care is about to make all of this matter much more than it has before

    If you have been practicing for more than a few years, you already know that occupational therapy reimbursement has been under pressure for a long time. The 2026 Medicare Physician Fee Schedule final rule from the Centers for Medicare and Medicaid Services, released October 31, 2025, continued a trend of flat or declining payment rates for outpatient OT. According to OT Potential’s 2026 reimbursement analysis, the proposed 1% decrease to OT and PT relative value units for 2026 came after a 0% increase in 2025 and a 3% decrease in 2024. The trajectory is real and most OTs feel it directly in their paychecks.

    What is changing right now, and what most clinicians have not fully internalized, is that the structure of the entire payment system is shifting underneath us. The shift is called value-based care.

    What value-based care actually means

    Value-based care is a payment model where providers and health systems are reimbursed based on the outcomes their patients achieve, not the volume of services delivered. Under traditional fee-for-service payment, an OT bills for each visit and gets paid for each visit. Under value-based care, payment is increasingly tied to whether the patient demonstrated measurable functional improvement against established benchmarks.

    CMS has been driving this shift through several specific programs. The Quality Payment Program, the Merit-based Incentive Payment System known as MIPS, and an expanding suite of Alternative Payment Models are all moving rehabilitation services toward outcomes-based reimbursement. The 2026 payment updates included a 0.75% increase for qualified APM participants and a 0.25% increase for everyone else, an early but clear signal that participating in alternative payment models will increasingly be where the financial upside is.

    The era of writing patient made progress toward goals in a discharge note and being reimbursed for it is ending. The era of demonstrating measurable functional change against defensible benchmarks is beginning.

    Why occupational therapy is structurally underprepared for this shift

    Here is the connection most clinicians have not drawn explicitly. The shift to value-based care requires outcomes data, and outcomes data is only as good as the assessments and progress-monitoring instruments producing it. Most of the assessments occupational therapists use to demonstrate progress, and most of the screeners they use to identify who needs services in the first place, were developed under CTT frameworks that produce raw scores, percentile bands, and standard scores. None of those formats give insurers what value-based payment models actually require.

    Insurers under value-based care want interval-level evidence of measurable functional change against established minimum-detectable-change thresholds. When a third-party reviewer asks whether a patient made meaningful progress, the answer they want is not, the patient’s standard score improved from 84 to 89. The answer they want is, the patient’s interval-level fine motor measure shifted by 0.45 logits, which exceeds the minimum detectable change threshold of 0.30 logits established in the calibration sample. One of those answers is opinion-vulnerable. The other is data.

    Closing this evidence gap requires investment at every level of the measurement pipeline: better screeners that identify who needs services earlier and more accurately, better assessments that produce the diagnostic and eligibility data on a defensible measurement scale, and better outcomes instruments that document functional change over an episode of care. The FMSAT and the FMPRS sit at the screener and ecological validity ends of that pipeline. They are one contribution among many that the profession needs.

    This evidence gap is one of the underrecognized reasons our profession has struggled to make the reimbursement case at the level of physical therapy or speech-language pathology. Both adjacent professions have invested more heavily in Rasch-calibrated, IRT-based assessment development over the last 20 years. The PEDI-CAT, the AM-PAC, and similar tools represent what that investment looks like. Occupational therapy has far fewer Rasch-calibrated tools across the screener, assessment, and outcomes layers, and that thinness in our measurement infrastructure shows up downstream as flatter reimbursement, narrower coverage policies, and ultimately compensation that has not kept pace with the cost of the training required to enter the field.

    How the O.T. Wizard platform fits into this picture

    The FMSAT and the FMPRS are not standalone projects. They are pieces of a larger evidence infrastructure being built into the O.T. Wizard platform, which is being rebranded as MyTherapyWizard.

    O.T. Wizard is a digital evaluation and outcomes platform built from the ground up on modern psychometric standards. The FMSAT lives inside the platform as a fast, defensible screener with clear research foundations. The FMPRS lives alongside it as the ecological validity companion during validation. The broader platform houses structured evaluation templates designed to produce the kind of data that holds up under value-based payment scrutiny. The architecture is PHI-free and operates under a 1EdTech-approved legal framework, which means the platform itself functions as a passive-accrual research engine. Every paired evaluation contributes to the dataset that makes the next generation of assessments stronger.

    The rebrand to MyTherapyWizard reflects the platform’s expanding scope beyond occupational therapy into a multi-discipline space for pediatric therapy professionals. The underlying mission stays the same. Build the measurement infrastructure our profession needs to move forward, in step with where reimbursement is going rather than chasing it after the fact.

    What you can do

    Our profession needs more Rasch-calibrated assessments. It needs more validated rating scales with strong ecological validity. It needs more normative datasets large enough to defend in peer review. And it needs more clinicians and educators willing to contribute the data that makes all of that possible.

    If you are an occupational therapist, an educator, a clinician working with adult or geriatric populations, or anyone interested in supporting the development of evidence-based assessment tools, here is how to get involved:

    • Request to be on the Norming Tryout Team and Contribute FMSAT data. The screener takes one minute per test taker. If you administer it after a session or screening you would have run anyway, the marginal time cost is essentially zero.
    • Complete the FMPRS when you can. The paired data is what makes the validation manuscript possible. Every paired submission directly strengthens the published evidence base our profession will use.
    • Look for the bands we need most. As of this week, the most urgent recruitment gaps are adolescents ages 12 to 17, both clinical and typical, three-year-olds in both groups, adults age 50 and older, and left-dominant test takers at every age.
    • Share this work with colleagues. The bigger and more representative the dataset, the stronger the eventual screener will be for the people you serve.

    Every paired submission you contribute is a small but real piece of building the measurement infrastructure our profession needs. Building a Rasch-calibrated rating scale and a CTT-validated performance screener together, on a normative dataset large enough to defend in peer review and broad enough to span the lifespan, is exactly the foundational psychometric work the field has needed for years. If we want occupational therapy to be reimbursed at the level our training and clinical expertise warrant under the new value-based payment models, we have to produce the kind of evidence other professions have already produced.

    That work does not happen in conference panels or position papers. It happens in datasets, calibrations, and validation manuscripts. It happens in projects like this one. And the people producing it are not academics in distant labs. They are clinicians and educators like you who choose to spend a few minutes on a Tuesday afternoon contributing to something larger than a single evaluation.

    About this project

    The FMSAT, Fine Motor Speed and Accuracy Test, is a one-minute screener for neuromotor lateralization and fine motor speed, currently in active normative data collection across the lifespan toward a peer-reviewed validation manuscript. The FMPRS, Fine Motor Participation Rating Scale, is the 12-item observer-rated companion used to establish ecological validity during the validation phase. Both instruments are part of the O.T. Wizard platform, rebranding to MyTherapyWizard. Pearl IRB Not Human Subjects Research determination on file (ID 2026-0154).

    Related topics Neuromotor lateralization assessment, hand dominance evaluation across the lifespan, Rasch analysis in rehabilitation, fine motor screening for educators, Response to Intervention RTI fine motor measures, MTSS Tier 1 and Tier 2 screening, ecological validity in occupational therapy, value-based care for outpatient therapy, Medicare Physician Fee Schedule 2026, evidence-based occupational therapy practice, school-based occupational therapy, OT reimbursement, alternative payment models for rehabilitation, progressive neuromotor condition monitoring, multiple sclerosis fine motor tracking, stroke rehabilitation outcomes measurement, lifespan motor assessment
  • When Behavior Eats Occupation: ABA’s Expansion

    When Behavior Eats Occupation: ABA’s Expansion

    A $639 million projection and a 3% pay cut

    On April 27, 2026, North Carolina Health News published a piece that should be required reading for every pediatric occupational therapist, physical therapist, and speech-language pathologist in the state. The headline: NC moves to rein in soaring autism therapy costs amid fraud concerns.

    The numbers were staggering. But the official NC DHHS policy paper Ensuring Person-Centered Care for Children with Autism Spectrum Disorder in the NC Medicaid Program, released for community feedback in late 2025, tells the underlying story even more clearly. NC Medicaid spending on Research-Based Behavioral Health Treatment (RB-BHT), which is overwhelmingly Applied Behavior Analysis (ABA), grew from $121.7 million in State Fiscal Year 2022 to $329.4 million in SFY 2024, a 171 percent increase in two years. The state’s own actuarial projection for SFY 2026 is $639 million. That is a 425 percent increase in four years, in one service line, in one state.

    In 2024, the NC General Assembly authorized a 15 percent rate increase for ABA across all seven RB-BHT CPT codes (97151 through 97157). In the same window, NC Medicaid pediatric occupational, physical, and speech therapy rates received no equivalent increase. They had not received a meaningful increase in nearly 20 years.

    Then, on October 1, 2025, NC Medicaid announced a 3 percent rate reduction across multiple service lines due to funding shortfalls. That reduction was applied to ABA, but only after ABA’s recent 15 percent raise. The same 3 percent was applied to pediatric OT, PT, and SLP, on a fee schedule that had not moved in two decades. The OT, PT, and SLP cut was subsequently paused after legal challenges and provider pushback, but the signal it sent is the point. The state was prepared to cut three established, board-credentialed, medically licensed pediatric therapy disciplines while a fourth service line, delivered overwhelmingly by paraprofessionals without medical credentialing, was on a trajectory to consume more than $600 million of the Medicaid budget in a single year.

    There is a question buried in those numbers that the rest of this post will try to answer. Medicaid coverage is statutorily anchored to medical necessity. If medical necessity is the threshold, how does a service delivered primarily by individuals with 40 hours of generalist training, no required college, no fieldwork, and no state healthcare licensure receive the lion’s share of the spend, while licensed medical professionals with master’s and doctoral degrees, board examinations, supervised fieldwork, and state licensure receive a rate cut?

    This post is not about whether ABA helps any individual child. It does, for some. This is about scale, scope, credentialing, and what happens to the developmentally rigorous, board-credentialed pediatric therapy disciplines when one adjacent discipline absorbs 30 to 40 hours per week of a child’s life, expands faster than its evidence base supports, and triggers fraud investigations that will eventually wash back across all of pediatric therapy.


    A brief history of ABA

    ABA’s foundations are in B.F. Skinner’s operant conditioning. The application to autism came from O. Ivar Lovaas at UCLA, whose 1987 paper is, to this day, the citation that anchors most of the field’s claims to insurers, school systems, and state legislatures.

    Lovaas reported that 47 percent of children who received 40 hours per week of intensive behavioral intervention for two to three years achieved “normal” intellectual and educational functioning, compared to 2 percent in the control group. That single study is where the 40-hour-per-week prescription standard came from. It is also where the language of “recovery” entered autism intervention discourse.

    The methodological problems with Lovaas 1987 are well documented and were acknowledged by Lovaas and his collaborators themselves: non-random group assignment, a sample functioning at a higher cognitive level than typical for autistic children at the time, unblinded outcome assessment, and an outcome definition built around IQ scores and mainstream classroom placement rather than quality of life. The original protocol also included aversives such as slaps and electric shock, which the field has since disavowed but which were central to the methods that produced the cited outcomes.

    Despite these problems, Lovaas 1987 became the evidence base cited in every state autism insurance mandate passed between 2007 and 2019. By the time more methodologically rigorous follow-up studies emerged, the reimbursement infrastructure was already built.


    What the research actually shows

    The strongest naturalistic dataset on ABA outcomes in the United States is the Department of Defense’s Autism Care Demonstration, which has tracked roughly 16,000 TRICARE-eligible children since 2014. The 2020 DoD Annual Report to Congress reached a remarkable conclusion for a discipline universally described as evidence-based: in their words, the current format of the demonstration project and the delivery of ABA services was not working for most TRICARE beneficiaries. Of the children studied over a one-year window, 76 percent showed no improvement on the standardized outcome measure, 16 percent improved, and 9 percent got worse. The report also stated, and this is the finding that should trouble anyone billing 30-plus hours per week, that “the number of hours rendered does not appear to impact outcomes.” The dose-response curve that justifies high-intensity ABA prescribing did not appear in the data.

    TRICARE still has not approved ABA as a basic medical benefit. It has been covered only under demonstration project structure for over a decade because it does not meet TRICARE’s hierarchy of evidence standard for proven medical effectiveness.

    In late 2025, the National Academies of Sciences, Engineering, and Medicine (NASEM) published a report commissioned by Congress to evaluate the demonstration. NASEM concluded that comprehensive ABA-based interventions are evidence-based practices and recommended that DHA cover ABA as a basic TRICARE benefit. But the same report explicitly criticized the way ABA is currently delivered: rigid hour prescriptions, mandatory assessments that do not inform treatment, restrictive setting requirements, and outcome measures that do not capture what families actually care about. The NASEM finding is essentially that the principles have evidence, but the delivery system the U.S. has built around them is misaligned with what the evidence supports.

    The honest summary: ABA principles, applied skillfully and in moderation by qualified clinicians, have empirical support for skill acquisition. The 40-hour-per-week dosage standard, the universal application to every autistic child, and long-term quality-of-life outcomes do not have the evidence base the field claims when speaking to payers.


    The fraud problem

    The NC Health News investigation, and the NC DHHS policy paper that followed, showed in publicly accessible numbers what happens when a payment stream grows 425 percent in four years with weak oversight.

    NC Health News obtained spending data through a public records request and found that 80 of the 200-plus ABA providers participating in NC Medicaid received at least $1 million in reimbursement in 2025. Payments to individual companies ranged as high as $64.91 million for a single Utah-based provider with 11 NC facilities. The Private Equity Stakeholder Project reported that 15 private equity-backed ABA companies operate more than 130 facilities in NC, making the state one of the most saturated PE-backed ABA markets in the country.

    NC Attorney General Jeff Jackson confirmed at an April 2026 House Select Committee on Oversight and Reform hearing that his office is conducting ongoing investigations into ABA billing in the state, including improper payments and “phantom billing,” which is the practice of submitting claims for therapy sessions that never took place or billing for more hours than were delivered. North Carolina is not alone. Federal prosecutors in Minnesota charged a defendant last year in what they described as the first criminal case tied to a sprawling ABA fraud scheme involving shell companies and millions in fraudulent Medicaid claims.

    The four-hat problem

    The NC DHHS policy paper named, in the state’s own words, the structural fraud vector that has been hiding in plain sight. From Action 8 of the policy paper:

    Some providers have reported to NCDHHS that these requirements in the RB-BHT Clinical Coverage Policy are insufficiently clear on which provider types may make an ASD diagnosis, referral to RB-BHT, or referrals for other ASD services… As a result, providers that do not offer RB-BHT sometimes refer an individual to an RB-BHT provider to make an ASD diagnosis, which raises conflict-of-interest concerns. In practice, the same provider may currently function as the diagnosing provider, the referring provider, the assessing provider and the service provider.

    That is the state acknowledging that an ABA company in NC can currently diagnose autism, refer the patient to itself, assess the patient, and deliver the services, all under one organizational roof, all billing the same payer. There is no parallel structure anywhere in pediatric OT, PT, or SLP, where the diagnosing physician or psychologist is institutionally and legally distinct from the treating therapist.

    Compounding this: under current Policy 8F, provisional ASD diagnosis can be made by any licensed psychologist, physician, or master’s-level clinician for whom diagnosis is within their scope of practice. For children under 3, a provisional diagnosis is sufficient to initiate ABA services, with full diagnosis required within 6 months. This is a structural funnel into ABA before differential diagnosis is complete, before OT/SLP/PT have evaluated the child, and before the family has been offered the full continuum of services NC Medicaid technically covers.

    Federal audits in other states

    This is not theoretical. The federal Department of Health and Human Services Office of Inspector General has already audited ABA billing in multiple states:

    The findings across these audits are consistent: lack of provider documentation to support the CPT codes billed, lack of documentation for the number of units billed or dates of service, delivery of ABA to members who did not receive required diagnostic evaluations or treatment referrals, and “impossible billing” practices such as billing for more than 24 hours of ABA in a single service date for a single member.

    NC has not yet been audited at the federal level for ABA, but the NC DHHS policy paper explicitly signals collaboration with the NC Department of Justice on program integrity going forward. The audit infrastructure is being prepared.

    Why this matters for OT, PT, and SLP

    Medicaid Program Integrity does not stop at one service category once it is mobilized. When NC DHHS and the Attorney General’s office expand pediatric therapy audits in response to the ABA findings, the standard practice is to extend that scrutiny to adjacent pediatric therapy lines. Outpatient OT, PT, and SLP share the same provider settings, the same referral sources, the same payers, and overlapping CPT code families with ABA. From a program integrity analytics standpoint, pediatric therapy disciplines are a single risk surface.

    NC Clinical Coverage Policy 10A already contains explicit Program Integrity language authorizing post-payment review by statistically valid random sampling, with data analytics on provider claims used to instigate review. The infrastructure to audit pediatric OT, PT, and SLP claims is already in place. ABA is the warm-up exercise.

    What this means practically: documentation standards that were adequate two years ago will not survive the 2026 to 2027 audit climate. Every evaluation, every plan of care, every progress note, and every outcome measurement needs to be defensible in standardized, ideally interval-level, terms. The defensive posture and the offensive advocacy posture converge here. The same outcome-measurement infrastructure that justifies a better fee schedule also protects practices from recoupment.


    The medical necessity question

    Medicaid coverage exists under a statutory framework of medical necessity. The federal Early and Periodic Screening, Diagnostic, and Treatment (EPSDT) mandate, the foundation of all pediatric Medicaid coverage, requires that covered services be medically necessary. State Medicaid programs implement this through clinical coverage policies that define which services are reimbursable, under what conditions, by which providers.

    This raises a question that should be uncomfortable for anyone reviewing NC’s ABA spending trajectory: if medical necessity is the threshold, why is the discipline with the lowest medical credentialing floor receiving the largest share of the pediatric therapy spend?

    A Registered Behavior Technician, who delivers the vast majority of direct ABA service hours, is not a medical professional under any standard definition. The RBT credential requires a high school diploma, 40 hours of training (frequently online), passage of a brief competency assessment, and an 85-question exam. There is no college coursework requirement. There is no clinical fieldwork requirement. There is no state healthcare licensure in most states, including North Carolina. The RBT is a paraprofessional credential issued by a private certification board (the Behavior Analyst Certification Board), not a state healthcare licensure body.

    Compare to the providers delivering OT, PT, and SLP under NC Medicaid: master’s or doctoral-level clinicians with accredited healthcare degrees, supervised clinical fieldwork measured in hundreds of hours, national board examinations, and state healthcare licensure. Even the assistant-level providers in OT, PT, and SLP have associate’s degrees, 16 weeks of supervised clinical fieldwork, national board examinations, and state licensure.

    The internal contradiction is plain. A Medicaid system that exists to provide medically necessary services has, in practice, prioritized funding a discipline whose direct-service workforce is not licensed as medical professionals over disciplines whose direct-service workforce is. The state’s own policy paper acknowledges this gap in Action 6, proposing to require BACB Registered Behavior Technician certification “prior to the provision of services” because, as the document notes, NC does not currently require its ABA technicians to obtain even the national BACB certification, much less state licensure. The state’s proposed fix is to require the basic 40-hour BACB credential. That is the floor being proposed, not the ceiling.

    This is not a comment on individual RBTs, many of whom are dedicated and skilled. It is a comment on the regulatory framework. If medical necessity is what determines what Medicaid covers, then the workforce delivering medically necessary services should be credentialed as medical professionals. The current NC structure does not meet that standard for ABA, and the spending pattern reflects that misalignment.


    NC pediatric therapy spending: the comparison

    Pediatric ABA in NC Medicaid

    From the NC DHHS policy paper, official state figures:

    • SFY 2022: $121.7 million
    • SFY 2023: $199.4 million
    • SFY 2024: $329.4 million (171 percent growth in two years)
    • SFY 2026 projected: $639 million (425 percent growth in four years)
    • 2024 rate increase: 15 percent across all seven ABA CPT codes
    • October 1, 2025 rate change: 3 percent reduction (applied after the 15 percent increase)
    • Number of Medicaid members receiving RB-BHT in SFY 2024: 8,706
    • Average per-child annual spend (NC Health News, FY 2025): approximately $37,600
    • Routine prescribing: 25 to 40 hours per week
    • No annual hour cap, no combined-discipline cap

    Pediatric OT, PT, and SLP in NC Medicaid

    NC Medicaid does not publish a comparable line-item breakdown of pediatric outpatient OT, PT, and SLP spending. State OT, PT, and SLP associations should be filing public records requests now to surface that data.

    What we do know is the authorization envelope. Under Clinical Coverage Policy 10A and EPSDT pediatric authorization, the practical maximum for a child receiving outpatient OT, PT, or SLP in NC is approximately 156 units per 6 months, per discipline. At 15 minutes per timed CPT unit:

    • 78 hours per year per discipline
    • 234 hours per year across all three rehab disciplines combined at full ceiling

    We also know the rate trajectory: no meaningful rate increase in nearly 20 years, followed by a proposed 3 percent reduction on October 1, 2025 (subsequently paused), on a fee schedule that currently reimburses pediatric OT at approximately $24 per 15-minute unit.

    The contact-hour ratio

    A child in a typical 30-hour-per-week ABA program receives approximately 1,500 hours of clinical contact per year.

    • ABA vs. OT alone at full pediatric annual ceiling: 1,500 hours vs. 78 hours, roughly 19 to 1
    • ABA vs. OT + PT + SLP combined at full ceiling: 1,500 hours vs. 234 hours, roughly 6.4 to 1

    Even when a child is authorized for the maximum of all three rehabilitation disciplines, ABA delivers more than six times the clinical contact hours.

    The dollar math, per child, per year

    At the current NC Medicaid pediatric OT rate of approximately $24 per 15-minute unit:

    • OT alone at full annual ceiling (312 units): approximately $7,488 per child per year
    • OT + PT + SLP combined at full annual ceiling, generous estimate: approximately $22,000 to $25,000 per child per year
    • ABA average per child per year: $37,600

    ABA spending per child is roughly five times higher than OT alone at full annual ceiling, and approximately 50 to 70 percent higher than all three rehab disciplines combined at maximum authorization. And that comparison assumes the rehab disciplines are billing at ceiling, which most are not, because the ceiling is rarely authorized in full.

    The state’s own policy paper acknowledges, in Action 7:

    if an assessment finds a member should receive occupational therapy, that may necessitate a lower intensity of RB-BHT based upon a child’s capacity to tolerate and benefit from the intensity of hours across all interventions.

    The state is, in essence, conceding that the current spending pattern is wrong: ABA is being prescribed at intensities that displace OT and the other rehab disciplines, even when an assessment would indicate the child needs OT instead of, or in addition to, ABA.


    The credentialing gap

    Who actually delivers most ABA service hours? Not Board Certified Behavior Analysts. The vast majority of direct-service ABA hours are delivered by Registered Behavior Technicians.

    Registered Behavior Technician (RBT)

    Under Behavior Analyst Certification Board requirements:

    • High school diploma or equivalent
    • Age 18 or older
    • Pass a criminal background check
    • Complete a 40-hour training course, frequently completed online in two to three weeks, often as part of employer onboarding
    • 3 of those 40 hours must cover ethics
    • Pass a brief competency assessment with a BCBA
    • Pass an 85-question multiple-choice exam
    • Total out-of-pocket cost can be under $100
    • No college coursework required
    • No clinical fieldwork required
    • No state healthcare licensure required in most states, including North Carolina

    NC DHHS’s policy paper notes that NC does not currently require even the national BACB Registered Behavior Technician certification. The state is now proposing to require it.

    Board Certified Behavior Analyst (BCBA)

    The supervising clinician credential is more substantial: master’s degree, 1,500 to 2,000 hours of supervised fieldwork, board examination, ongoing continuing education. The BCBA is the responsible clinical decision-maker but typically is not the person delivering the direct service hours.

    Certified Occupational Therapy Assistant (COTA)

    For comparison, here is what an OT Assistant brings to the same room:

    • Associate’s degree from an ACOTE-accredited OTA program, typically two years of college coursework
    • Roughly 16 weeks of full-time Level II fieldwork, approximately 640 hours
    • Pass the NBCOT national board examination for COTAs
    • State licensure
    • Continuing education units required for license renewal
    • Practices under the supervision of a licensed OT, with supervision frequency and scope defined by state law
    • Adherence to the AOTA Code of Ethics and state practice act

    Occupational Therapist (OT)

    • Master’s or doctoral degree from an ACOTE-accredited program
    • Roughly 24 weeks of full-time Level II fieldwork, approximately 960 hours
    • Pass the NBCOT national board examination for OTs
    • State licensure in every state, including NC
    • 15 CEUs per renewal cycle in NC
    • Adherence to the AOTA Code of Ethics and state practice act

    The contrast that matters

    A COTA, who works under the supervision of a licensed OT, has roughly (at minimum) two full years of accredited college coursework, plus 16 weeks of supervised clinical fieldwork, plus a national board examination, plus state healthcare licensure, plus ongoing CEUs before delivering hands-on pediatric therapy.

    An RBT, who is the frontline provider for the majority of ABA service hours, has 40 hours of training, no college, no fieldwork, and no state healthcare licensure before delivering hands-on pediatric therapy. In NC, even the basic national BACB credential is not currently required.

    A licensed OT or COTA delivering one hour of NC Medicaid pediatric OT, after two years (COTA) or six-plus years (OT) of accredited coursework and clinical training, is reimbursed at a rate that has not risen in nearly 20 years. An RBT, after 40 hours of training, is part of a payment stream that grew 425 percent in four years and is projected to consume $639 million in 2026.


    Where the money is: ABA companies absorbing OT and SLP

    A growing trend in pediatric autism services: ABA companies are hiring licensed OTs and SLPs to deliver services within an ABA-organized clinical model. Some practitioners arrive through dual-credentialing pathways, since the BACB has removed degree-field restrictions for BCBA candidates and made the OT-to-BCBA and SLP-to-BCBA transitions more accessible. Others are simply employed to deliver OT or SLP services in-house, but inside a treatment plan organized around 25 to 40 hours per week of ABA.

    The result is a structural absorption. Licensed clinicians from the rehab disciplines are increasingly delivering care inside ABA-organized clinical models, rather than the other way around. The treatment plan is built around behavior analysis. OT and SLP become supplemental services to a primary ABA intervention. The child’s calendar, the care coordination, and the parent-facing narrative all center on ABA, with OT and SLP positioned as add-ons.

    This is the inverse of what NC DHHS’s own policy paper recommends: whole-person care planning with the full continuum of evidence-based services coordinated by a licensed professional, and ABA used at the intensity clinically necessary rather than as the organizing modality.


    Where ABA infringes on OT scope

    AOTA’s scope of practice statement, and every state OT practice act, anchors the profession around occupation: ADLs and IADLs, feeding, eating, and swallowing, sensory processing and integration, fine and visual-motor skills, play, school participation, and meaningful engagement in life situations across home, community, and school contexts.

    ABA programs are increasingly billing into the same scope of practice:

    • Feeding therapy delivered by RBTs using food chaining, escape extinction, and behavioral feeding protocols. This is historically OT and SLP scope, and the AOTA Practice Guideline on Feeding, Eating, and Swallowing explicitly identifies OTs as uniquely positioned to evaluate and treat these problems due to the integration of sensory, motor, and contextual factors.
    • Toileting programs framed as ABA “ADL training,” delivered without the underlying motor planning, sensory processing, interoception, and developmental readiness assessment that an OT brings.
    • Fine motor skill acquisition including handwriting, scissor use, and utensil use, delivered as discrete trial training without consideration of grasp development, in-hand manipulation, bilateral coordination, or visual-motor integration.
    • Sensory regulation strategies delivered without sensory integration training, often using behavioral reinforcement paradigms that can be in direct conflict with sensory-based clinical reasoning.
    • Play skill development delivered as discrete trial training, which structurally cannot replicate the developmental work of OT-facilitated play.

    The clinical risk is not theoretical. A child whose food refusal is being treated as behavioral by an RBT-delivered feeding program may have undiagnosed dysphagia, retained primitive reflexes, oral-motor apraxia, sensory-based food aversion, or ARFID. A child whose handwriting is being treated as a compliance issue may have undiagnosed developmental coordination disorder or visual-perceptual deficits. A child whose self-injury is being addressed through behavioral extinction may have undiagnosed sensory dysregulation or pain.

    The ICF-CY framework makes this distinction clear. ABA’s traditional outcome targets sit at the body function and activity level. OT’s outcome targets sit at the participation level, in life situations across home, school, and community. These are not interchangeable, and a child whose week is dominated by body-function and activity-level work in a controlled 1:1 setting may never get to the participation work that produces durable, generalizable change.


    The 6 to 8 hour per day problem

    The clinical issue with high-dose ABA prescribing is not only what is being delivered in the ABA hours. It is what is not being delivered in the hours that are no longer available.

    Many ABA prescriptions land at 25 to 40 hours per week, often 6 to 8 hours per day for preschool-age children. A 4-year-old in ABA from 8 AM to 2 PM has no calendar space for OT, no calendar space for SLP, no calendar space for PT, no time for naturalistic family interaction, no time for play with neurotypical peers, no time for developmentally normative experiences in community settings.

    The insurance and Medicaid reality compounds this. When ABA absorbs the weekly therapy budget or the child’s tolerance for therapy, OT, SLP, and PT get cut to 30-minute sessions once a week, or eliminated entirely. The 156-unit ceiling becomes irrelevant when the child has no time on the calendar for those sessions. Families are often not offered a coordinated multidisciplinary plan. They are referred to ABA, that becomes the plan, and the other disciplines are reduced to consultation or eliminated.

    Pediatric OT is grounded in distributed practice across natural contexts. A child needs OT-informed strategies woven through meals at the family table, transitions in real classrooms, play with siblings, and community outings. That cannot happen when the child is in a 1:1 controlled clinical environment for the majority of waking hours.


    What pediatric OT must do

    The defensive and offensive responses converge. Four priorities.

    Build the outcome-measurement infrastructure. Pediatric OT cannot continue documenting in narrative paragraphs and informal goal-attainment scaling and expect to survive the audit climate that is coming, much less to win fee-schedule advocacy battles. The profession needs interval-level outcome measurement using Rasch-grounded instruments that produce defensible, change-detectable, statistically interpretable data, mapped to ICF-CY participation-level outcomes. The next generation of pediatric OT documentation needs to look more like a psychometric report and less like a clinical narrative.

    Pursue fee-schedule advocacy with data, not testimony. Personal testimony from therapists about the cost of doing business has not moved the needle in nearly 20 years. What might: a defensible return-on-therapy-investment dataset showing measurable participation-level change per dollar across OT, PT, SLP, and ABA. The legislature responded to the NC ABA spending data because it was specific, quantified, and contrasted. The same approach applied to pediatric OT, PT, and SLP would be hard to ignore.

    Defend scope of practice at the state level. State licensure boards, Medicaid coverage policy, and state Practice Acts are the legal mechanisms that define what discipline can deliver what service. Feeding, sensory integration, motor skill training, ADL training, and play-based participation work are OT and SLP scope under every relevant statute and AOTA practice document. Documenting scope encroachment in writing, with case examples, and submitting it to state licensure boards and Medicaid clinical coverage policy reviewers is how scope gets defended.

    Build the coordinated multidisciplinary alternative and educate referral sources. The strongest argument is not “ABA is bad.” It is that a coordinated OT plus SLP plus parent-coaching plus targeted developmental behavioral support model, delivered at 6 to 10 total hours per week with measurable participation-level outcomes, produces durable change at a fraction of the cost and a fraction of the developmental opportunity cost. Most pediatricians refer to ABA reflexively after an autism diagnosis. Most parents have never been offered a clear picture of what each pediatric therapy discipline addresses or what an integrated plan looks like. Parent-facing and pediatrician-facing materials, grounded in the ICF-CY framework, would shift the referral conversation.


    Closing

    This is not a turf war. It is a question about who is qualified to deliver what, what the actual evidence supports, what a child’s developmental window is best used for, and who is being paid what when public money is involved.

    Medicaid exists under a statutory framework of medical necessity. That framework is supposed to mean something. When a discipline whose direct-service workforce is not credentialed as medical professionals receives a 15 percent rate increase, expands 425 percent in four years, and consumes a projected $639 million in a single state budget year, while disciplines whose direct-service workforce is licensed as medical professionals receive no rate increase for nearly 20 years and then a proposed 3 percent reduction, the framework is not being applied consistently. NC DHHS’s own policy paper, released for community feedback in 2025, acknowledges the structural problems: providers diagnosing autism and then referring patients to their own services, treatment plans that are not individualized, ABA being used as primary treatment when less intensive evidence-based therapies would be more appropriate, and audits in Indiana, Wisconsin, and Massachusetts already documenting tens of millions in improper payments.

    ABA at moderate intensity, delivered by well-supervised clinicians, can be a useful component of an autism intervention plan for some children. ABA at 30 to 40 hours per week, delivered primarily by paraprofessionals with 40 hours of training, on a payment trajectory that has grown 425 percent in four years, while one provider collects $64.91 million from NC Medicaid in a single year, is a different conversation.

    The NC fraud investigations, the proposed Policy 8F revisions, and the NC DHHS policy paper are an opening. Clinical Coverage Policy is being rewritten in real time. The legislature is paying attention. The Attorney General is paying attention. Audit infrastructure is being built that will, predictably, expand to OT, PT, and SLP next.

    Pediatric OT has the evidence base, the credentialing rigor, the participation-focused framework, the developmental science, and the ICF-CY anchor. What it needs is the measurement infrastructure to translate clinical work into payer-defensible data, the advocacy coordination to get that data in front of policymakers, and the practice-owner discipline to make documentation audit-ready before the audit arrives.

    The pediatric population this profession serves deserves better than what the current system is delivering. So does the profession.

    Stephanie, OT/L, MS
    Head Wizard


    References and primary sources

    NC-specific policy documents

    1. NC DHHS. (2025). Ensuring Person-Centered Care for Children with Autism Spectrum Disorder in the NC Medicaid Program. https://medicaid.ncdhhs.gov/policy-paper-ensuring-person-centered-care-children-autism-spectrum-disorder-nc-medicaid-program/open
    2. NC Medicaid. Clinical Coverage Policy 8F: Research-Based Behavioral Health Treatment for Autism Spectrum Disorder. https://medicaid.ncdhhs.gov/8f-research-based-behavioral-health-treatment-rb-bht-autism-spectrum-disorder-asd/download?attachment=
    3. NC Medicaid. Outpatient Specialized Therapy Services (Clinical Coverage Policy 10A). https://medicaid.ncdhhs.gov/providers/programs-and-services/medical/outpatient-specialized-therapy-services
    4. NC Medicaid. October 1, 2025 NC Medicaid Rate Reduction Questions and Answers. https://medicaid.ncdhhs.gov/providers/claims-and-billing/october-1-2025-nc-medicaid-rate-reduction-questions-and-answers

    Investigative reporting

    1. Baxley, J. (2026, April 27). NC moves to rein in soaring autism therapy costs amid fraud concerns. North Carolina Health News. https://www.northcarolinahealthnews.org/2026/04/27/autism-therapy-costs/
    2. Private Equity Stakeholder Project. (2026). Private Equity in ABA: Report on the Behavioral Health Industry. https://pestakeholder.org/wp-content/uploads/2026/04/PESP_Report_PE-in-ABA_2026.pdf

    Federal audits and prosecutions

    1. U.S. Department of Health and Human Services Office of Inspector General. (2024). Indiana Made at Least $56 Million in Improper Fee-for-Service Medicaid Payments for Applied Behavior Analysis Provided to Children Diagnosed with Autism. https://oig.hhs.gov/documents/audit/10123/A-09-22-02002.pdf
    2. U.S. Department of Health and Human Services Office of Inspector General. (2025). Wisconsin Made at Least $18.5 Million in Improper Fee-For-Service Medicaid Payments for Applied Behavior Analysis Provided to Children Diagnosed With Autism. https://oig.hhs.gov/documents/audit/10497/A-06-23-01002.pdf
    3. Office of the Inspector General Massachusetts. (2024). MassHealth and Health Safety Net: 2024 Annual Report. https://www.mass.gov/doc/masshealths-applied-behavior-analysis-program-service-providers-oig-2024-annual-report/download
    4. U.S. Attorney’s Office, District of Minnesota. First Defendant Charged in Autism Fraud Scheme. https://www.justice.gov/usao-mn/pr/first-defendant-charged-autism-fraud-scheme-0

    National evidence reviews and DoD reports

    1. National Academies of Sciences, Engineering, and Medicine. (2025). The Comprehensive Autism Care Demonstration: Solutions for Military Families. Washington, DC: National Academies Press. https://www.nationalacademies.org/our-work/independent-analysis-of-department-of-defenses-comprehensive-autism-care-demonstration-program
    2. U.S. Department of Defense. (2020). Annual Report on Autism Care Demonstration Program. https://health.mil/Reference-Center/Congressional-Testimonies/2020/06/25/Annual-Report-on-Autism-Care-Demonstration-Program
    3. Lovaas, O. I. (1987). Behavioral treatment and normal educational and intellectual functioning in young autistic children. Journal of Consulting and Clinical Psychology, 55(1), 3–9.

    Credentialing bodies and scope of practice

    1. Behavior Analyst Certification Board. Registered Behavior Technician (RBT) Requirements. https://www.bacb.com/rbt/
    2. American Occupational Therapy Association. Occupational Therapy Scope of Practice. https://www.aota.org/practice/practice-essentials/scope-of-practice
    3. American Occupational Therapy Association. Code of Ethics. https://www.aota.org/practice/practice-essentials/ethicsstandardsa/code-of-ethics
    4. National Board for Certification in Occupational Therapy. https://www.nbcot.org/
    5. Accreditation Council for Occupational Therapy Education. https://acoteonline.org/
    6. AOTA Practice Guideline. The Practice of Occupational Therapy in Feeding, Eating, and Swallowing. https://www.oregon.gov/otlb/Documents/The%20Practice%20of%20Occupational%20Therapy%20in%20Feeding,%20Eating,%20and%20Swallowing.pdf

    Federal Medicaid framework

    1. Centers for Medicare & Medicaid Services. Early and Periodic Screening, Diagnostic, and Treatment (EPSDT). https://www.medicaid.gov/medicaid/benefits/early-and-periodic-screening-diagnostic-and-treatment

    Trauma and outcomes literature on ABA (referenced in evidence section)

    1. Kupferstein, H. (2018). Evidence of increased PTSD symptoms in autistics exposed to applied behavior analysis. Advances in Autism, 4(1), 19–29. Note: Journal issued an Expression of Concern in 2025. Findings should be cited with methodological caveats.
    2. Leaf, J. B., Ross, R. K., Cihon, J. H., & Weiss, M. J. (2018). Evaluating Kupferstein’s claims of the relationship of behavioral intervention to PTSS for individuals with autism. Advances in Autism, 4(3), 122–129.
    3. McGill, O., & Robinson, A. (2021). “Recalling hidden harms”: Autistic experiences of childhood applied behavioural analysis (ABA). Advances in Autism, 7(4), 269–282.
  • Understanding and Using Our Performance Bands

    Understanding and Using Our Performance Bands

    Why we use these performance bands

    When I built the scoring system for OT Wizard I wanted performance bands that would do three things at once: hold up psychometrically, work across a wide age range, and use language that is genuinely strengths-based rather than just sounding nice. After looking at how the major standardized assessments handle this, I landed on a framework that is closely aligned with what the field already uses.

    Our performance bands

    RangeBand LabelInterpretation
    85-100%MasteredPerforms skill consistently across contexts with little to no support
    70-84%ProficientPerforms reliably with minimal support in most contexts
    60-69%DevelopingSkill is somewhat present but may require occasional prompts or support
    40-59%EmergingSkill performed inconsistently or only in structured/familiar settings
    20-39%BeginningEarly attempts or partial skill components observed
    0-19%Not Yet ObservedNo evidence of skill use or minimal attempts

    The labels describe where a skill is in its trajectory. They do not describe the individual being assessed.

    Why the performance bands language is neuroaffirming

    The neuroaffirming move in assessment language is not softness. It is precision and neutrality. Words like “Developing,” “Emerging,” and “Beginning” describe a trajectory of skill acquisition. They imply that growth is possible without making any judgment about the person being assessed.

    Compare that to deficit-state language like “Inconsistent” or “Limited.” Those words describe what someone is not doing. They locate the problem in the individual rather than in the skill being measured. Clients and family members who have spent years on the receiving end of deficit language tend to be especially sensitive to it, and that is true whether the client is a six year old, a teenager, or an adult.

    The “Not Yet Observed” label at the bottom of the scale is doing important work too. The “Yet” signals that absence of observation is not a fixed trait. It keeps the door open without assuming a specific timeline.

    How the performance bands work across ages

    As OT Wizard migrates to “MyTherapyWizard”, it is designed to be used across the full age range, from young children through adults. A common concern I hear is that words like “Developing” or “Emerging” feel too young for older clients. I understand the instinct, but the issue is usually not the labels. It is the items being scored.

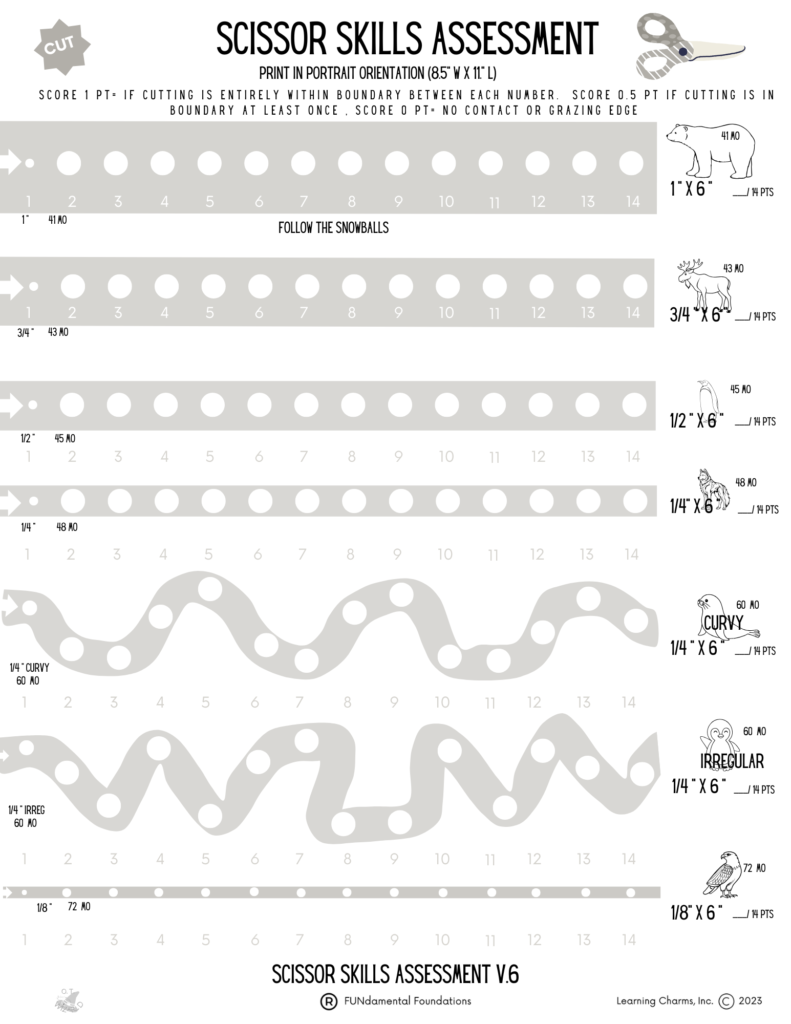
    A teenager being assessed on age-appropriate executive function, handwriting fluency, or self-advocacy skills will not feel infantilized by an “Emerging” rating. An adult being assessed on workplace task initiation or community mobility will not either. The mismatch comes when older clients are scored on items that were really designed for younger ones. That is an item-pool problem, not a label problem. The best way to solve this is to select guided evaluations for the appropriate age population and to skip subdomains (such as scissor skills) that aren’t relevant.

    This is why our platform invests so heavily in age-appropriate item development. The labels stay consistent. The items adapt to the person.

    How our performance bands compare to other assessments

    The language we use is very much in line with how the major developmental and rehabilitation assessments handle their descriptive categories. Here is a quick look:

    AEPS (Assessment, Evaluation, and Programming System) uses Consistently Performed, Inconsistently Performed, and Does Not Perform. These describe pattern, not stage.

    HELP (Hawaii Early Learning Profile) uses Mastered, Emerging, and Not Yet Present. The same trajectory framing we use.

    Vineland-3 (birth through 90+ years), which is the gold standard for cross-age range assessments, uses High, Moderately High, Adequate, Moderately Low, and Low. These are statistical comparisons rather than developmental stages.

    BOT-2 (ages 4-21) uses Well-Above Average, Above Average, Average, Below Average, and Well-Below Average. Again, statistical comparisons that work across the full age range.

    Sensory Profile-2 (birth through 14) uses Much Less Than Others, Less Than Others, Just Like the Majority of Others, More Than Others, and Much More Than Others. Fully neutral frequency language.

    The pattern across the field is clear. Assessments that span wide age ranges either use statistical comparison language or trajectory language. The trajectory words we use are standard psychometric vocabulary, not preschool-coded terms.

    Why our band labels are consistent across every report

    The band labels are hardcoded into our scoring system on purpose. This is not a limitation. It is an intentional architectural choice tied to psychometric integrity.

    When labels stay consistent across every report the platform generates, three things happen. Inter-rater reliability is preserved. Reports remain comparable across time, across clinicians, and across settings. And the Rasch calibration that powers the underlying scoring stays valid.

    If a guided template is custom built for a specific clinician or discipline, the items inside it can be tailored. The descriptors can be adjusted. The band labels themselves stay the same so that a “Proficient” rating means the same thing in every report, no matter who generated it or who the client is.

    The basic scoring framework

    Every guided evaluation in OT Wizard/ MyTherapyWizard follows this same scoring logic:

    1. Items are rated against defined criteria.
    2. Item-level scores are aggregated to produce a percentage within a domain.
    3. The percentage maps to one of the six performance bands above.
    4. The band label and its interpretation are pulled into the report automatically.
    5. The narrative interpretation expands on the band finding in plain language for the reader.

    Because the bands are tied to underlying percentages, and because the items are built with psychometric scoring properties baked in, the system can produce reliable, comparable results across evaluations, across clinicians, and eventually across the entire normative dataset as it grows.

    Bottom line

    The performance bands in OT Wizard / MyTherapyWizard are not arbitrary. They are designed to be neuroaffirming, psychometrically sound, and consistent across the full age range we serve, from young children through adults. The language is strengths-based without sliding into deficit framing. It mirrors what the major assessments already use. It stays consistent across every report so that what a clinician reads, what a family member reads, and what a teacher or care partner reads all carry the same meaning. See more about the development of OT Wizard.

  • 1,480 Trials: Building a Fine Motor Screener OTPs Actually Want to Use

    1,480 Trials: Building a Fine Motor Screener OTPs Actually Want to Use

    A standardized worksheet with rows of small circles. Thirty seconds per hand. A sharpened pencil. That is the entire assessment.

    We call it Fine Motor Speed and Accuracy Test (FMSAT)- because that is where we want the test taker’s attention. But the data is telling us the test is not really about speed at all. It is about which hand the nervous system has committed to, and when, and why some people never fully commit. After more than 1,400 bilateral trials across ages three to seventy-plus, the data is starting to show what this simple task can actually see.

    Looking for a Fine Motor Screener

    Pediatric and adult OTPs have long needed a brief, standardized, score-based measure that complements clinical observation without replacing it. We built the Fine Motor Speed and Accuracy Test (FMSAT) to fill that gap. But we wanted more than a number. We wanted evidence that the number maps onto the broader clinical picture a skilled clinician already sees.

    The correlation picture emerging from our data is that kind of evidence. FMSAT scores are converging with the O.T. Wizard Fine Motor domain score, with related motor domains, and with the overall composite. They are converging with the Fine Motor Participation Rating Scale (FMPRS), our companion clinician observational instrument. And deliberately, we looked outside the O.T. Wizard platform for independent evidence, because self-referential data is not ecological validity.

    One number stands out. Ninety-seven percent. That is the rate at which a child’s self-selected first hand on the FMSAT matches the clinician’s independent rating of their grasp hand, captured in the same session. For context, most concurrent validity correlations in pediatric motor assessment literature sit in the .40 to .60 range. A 97% agreement rate between a one-minute task-based score and an independent clinician observation is not ordinary.

    O.T. Wizard

    O.T. Wizard is a clinical intelligence platform for occupational therapy, built by a working clinician. It is not billing software with clinical documentation bolted on. The architecture runs the other direction. Evaluations produce structured scored data across clinical domains. Plans of care, goals, session measurement, and progress reports compose from that data. The FMSAT is embedded inside the evaluation workflow, which means every FMSAT score sits alongside clinician ratings captured in the same session, by the same clinician. That co-occurrence is what makes this dataset rare and the ecological validity analysis possible.

    The FMSAT National Team

    Assessment compliance is the quiet killer of norming studies. The FMSAT has mostly solved that problem by accident, because we designed it to be fast, and being fast made it feel like a game. One team member put it this way:

    “I find this assessment really easy to administer and the students really like it. I’ve been telling them it’s a game we’re starting with to pop bubbles and they get really excited. One of my students was actually frustrated with me when he didn’t get to go first today LOL.”

    The lifespan data is being built by a distributed team of licensed OTPs from school-based and clinic-based settings. Some of our most active therapist researchers to date are: Lauren David, Veronica Sydlowski, Kelly Simiele, Christie LeClair, Meghan Taylor, Jenna Hogan, Kayla Hauck, Chanda Waller, Ronda Horton, Catherine Jones, Meredith Pait, and the full Learning Charms therapy team. The project is IRB-determined as not-human-subjects research (Pearl IRB 2026-0154). A sixty-second administration produces meaningful data on both hands, where Hand One is the test taker’s self-selected first hand and Hand Two is the other.

    Combined Lifespan Trends

    A developmental trajectory is emerging from the combined data. The gap between Hand One and Hand Two rises through early childhood, peaks in young adulthood, and compresses again in adults sixty and older. One of the patterns that surprised us most is how far that compression goes. In our current data, the Hand One to Hand Two gap in adults in their sixties looks more like the gap in a six-year-old than in a forty-year-old. A one-minute screener appears to be catching the full arc of neuromotor lateralization across the lifespan.

    There is a plausible framework for part of this pattern. The HAROLD effect, or Hemispheric Asymmetry Reduction in Older Adults, was first described by Cabeza (2002) and has since been documented in motor performance by Seidler et al. (2010) and Sullivan et al. (2010). The pattern we are seeing in adults sixty and older is consistent with what HAROLD predicts: reduced hemispheric specialization as the brain ages, which would show up on a bilateral motor task as a compressed gap between hands. Our data is early and the sample in this age range is still small. We are not in a position to claim HAROLD replication. We are in a position to say the trend line in our data is pointing where the literature would predict it should point, and we intend to keep collecting.

    What It May Be Measuring

    The test directs attention toward speed and accuracy. The constructs surfacing in the data are different. Fine motor capability, reflected in the Hand One score. Neuromotor lateralization, reflected in the gap between the two hands. These are separate clinical questions and should not be collapsed into a single number. The X-score, which counts errors on distractor circles the test taker is instructed to skip, appears to capture a third construct entirely: impulse control. That will be its own study.

    The Finding That Is Changing How We Build Norms

    Left-dominant test takers show about half the asymmetry of right-dominant test takers. We think a lifetime of adapting to right-biased tools, scissors, can openers, computer mice, spiral notebooks, trains the non-dominant hand upward. Whatever the cause, it means the norms we build cannot treat everyone the same way. More to come on that front.

    Join the Team

    The dataset now spans ages three through seventy-plus, and collection continues. We are specifically seeking OTPs with access to adult populations to join the National Team. We plan to finish the research by mid summer 2026. Contributors are acknowledged by name in the validation work and earn CEUs through the O.T. Wizard platform. If you are interested, reach out: stephanie@learningcharms.com.


  • Value-Based Care Is Coming for Therapy Practices

    Value-Based Care Is Coming for Therapy Practices

    Value-Based Care Is Coming for Therapy. Here’s What It Means — and Why Some Practices Are Already Ready.


    A significant document landed this week. AOTA, APTA, and ASHA — the three largest therapy professional associations in the country — released a joint publication: Value-Based Care for Therapy: A Provider’s Guide. When three associations that rarely agree on anything publish something together, it is worth paying attention to.

    This post is for occupational therapists, physical therapists, speech-language pathologists, mental health professionals, and the practice owners who employ them. Whether you work in a clinic, a school, a hospital, or private practice — this shift is coming for you.


    What Is Value-Based Care, and Why Does It Matter Now?

    For decades, therapy has been paid under a fee-for-service model. You provide a service, you bill a code, you get paid. Volume drives revenue. The system rewards doing more, not necessarily achieving more.

    Value-based care flips that model. Under VBC, payment is tied to the value of care delivered, meaning the outcomes achieved relative to the cost of achieving them. Payers want evidence that patients improved, that care was efficient, and that therapy dollars produced measurable functional change.

    CMS has stated formally that by 2030, all Medicare plans and most Medicaid plans will include accountability for quality and total cost of care.

    And for anyone thinking this is only a Medicare issue, it is not. Commercial payers historically follow Medicare and Medicaid, typically within two to five years of federal adoption.Plans such as United Healthcare, Blue Cross, Aetna, United, and Cigna watch the federal model and build similar requirements into their own contracts. This is an incoming reality for your entire payer mix, regardless of the population you serve.


    What Will Payers Actually Require — and How Will They Get the Data?

    This is where it gets specific, and where most therapy providers are underprepared.

    Under value-based care contracts, payers will not rely solely on claims data. They will aggregate multiple data streams to generate a risk-adjusted performance score for each provider. That score determines reimbursement rates, bonus eligibility, penalty exposure, and increasingly — prior authorization requirements.

    The data sources payers will draw from include diagnostic codes, functional status scores at evaluation and discharge, episode length, caregiver and patient-reported outcome measures, and social determinants of health. Together, these paint a picture of who your patients are, how complex their needs are, and whether your billed intervention produced meaningful change.

    The risk adjustment piece deserves particular attention. Payers use a system called Hierarchical Condition Categories (HCC) to score the complexity of a provider’s caseload. The formula looks at diagnosis codes to predict how difficult and costly a patient’s care should be. The intent is fairness: a practice treating children with complex medical histories and significant functional deficits should not be benchmarked against a practice treating mild developmental delays.

    But here is the problem. If your documentation does not accurately capture patient complexity (ex: if your evaluations are narrative rather than structured, if diagnoses are under coded, if functional deficits are described rather than measured by metrics) the HCC formula underestimates your caseload. Your practice looks like it is treating simpler patients than it is. Your performance scores suffer. Your reimbursement suffers. Thorough, structured clinical documentation is no longer just professional best practice. It is financial protection.

    There is also a significant upside for high performers. Practices that consistently demonstrate measurable functional outcomes under VBC contracts will be rewarded with reduced prior authorization burdens. For any therapist who has spent hours writing auth appeals, had sessions denied mid-episode, or watched a child lose momentum because a payer delayed approval, that outcome is worth working toward.


    What the VBC Guide Specifically Calls For

    The joint guide outlines several infrastructure requirements for therapy providers preparing for value-based care. Here are the most consequential:

    1. Objective, structured outcome measurement. The guide is explicit: quality measures require scoreable, comparable data — not narrative notes. Payers need to be able to extract, aggregate, and benchmark outcome data across providers. Narrative documentation cannot be benchmarked. Structured, scored data can.

    2. Patient and caregiver-reported outcome measures. The guide specifically highlights the growing importance of capturing outcomes from the patient and family perspective — not just the clinician’s clinical observation. These measures capture health status, function, and quality of life as experienced by the people receiving care. They are becoming a required component of VBC quality scoring.

    3. Longitudinal data across the full episode of care. A snapshot evaluation is not sufficient. Payers need a before and after — baseline functional status, mid-episode progress, and discharge outcome. Without that full-episode arc, there is no way to calculate the value of the intervention.

    4. ICF framework for data exchange. The guide references the International Classification of Functioning, Disability, and Health — ICF — as the standard framework for exchanging functional status data across providers, settings, and payers. Providers whose documentation is built on ICF structure are already speaking the language payers are building their systems around.

    5. Social determinants of health. VBC models are increasingly required to capture nonmedical factors that influence outcomes — housing stability, transportation access, food security, economic stability. These factors affect therapy outcomes and will be factored into risk adjustment models.


    Why Most EMRs and EHRs Will Leave Practices Exposed

    Here is the uncomfortable truth: most electronic medical records and electronic health records were built for fee-for-service. They are fundamentally accounting systems — designed to track what was billed, scheduled, and coded. They do an adequate job of supporting claims submission. They do almost nothing to capture clinical intelligence.

    When value-based care contracts begin requiring structured outcome data, longitudinal functional measures, and caregiver-reported scores, practices running on a standard EMR will have nothing meaningful to submit. The documentation exists, but it is locked in narrative notes that cannot be extracted, scored, or benchmarked. That is a serious vulnerability.

    The practices that will navigate this transition well are the ones that have been capturing structured, measurable clinical data all along — not because a payer required it, but because good clinical practice demanded it.


    If You Are Using OT Wizard, You Are Already Ahead

    OT Wizard was not built to react to value-based care. It was built on the clinical and psychometric principles that value-based care is now catching up to.

    Here is how OT Wizard already delivers what the VBC guide calls for:

    1. Objective functional outcome data. OT Wizard generates structured documentation grounded in the ICF framework — the exact standard the VBC guide identifies for measuring and exchanging outcome data. Every evaluation produces metrics on each domain, subdomain and a composite score, structured functional data, not just narrative description.

    2. Caregiver and patient-reported measures. OT Wizard captures scored questionnaires from caregivers and families at baseline, mid-therapy, and discharge. That full-episode caregiver perspective is built into the platform workflow — not an add-on, not a separate form. It is the data payers will specifically look for.

    3. Longitudinal data across the episode of care. Because OT Wizard tracks from intake through discharge, pre and post functional data is built into every case. That full-episode arc is what payers need to calculate a risk-adjusted performance score accurately and fairly.

    This is what separates a clinical intelligence system from an accounting system. OT Wizard is not just recording what happened. It is measuring what changed.


    What Is Coming Next

    We are not stopping here. We are currently building Billing Wizard feature — a dedicated insurance billing feature integrated directly into OT Wizard. Your clinical outcome data and your claims will live in the same system. As value-based care contracts begin requiring outcome data alongside claims submissions, that integration will matter enormously.

    And not too far away, we will develop Therapy Wizard — an expansion that will bring this same clinical intelligence foundation to speech-language therapy, physical therapy, and mental health. One platform, one outcome framework, built for the full therapy team. Because value-based care does not silo disciplines — and neither should your documentation infrastructure.


    The Bottom Line

    The payment landscape is changing and the timeline is real. The practices that will thrive are not the ones that scramble to retrofit their documentation after the contracts change but are the ones that already have the infrastructure in place.

    If you are an OT, PT, SLP, or mental health professional asking what you can do right now: document with precision, capture complexity, measure function at intake and discharge, and make sure your platform is built to produce structured data… not just notes.

    If you are a practice owner: this is an infrastructure conversation, not just a clinical one. The system you are documenting in today will determine whether you can compete for value-based contracts tomorrow.

    The field is changing. OT Wizard was already here.


  • Fine Motor Speed and Accuracy (FMSAT) Norming Update

    Fine Motor Speed and Accuracy (FMSAT) Norming Update

    Overview

    This brief summarizes findings from the FMSAT (Fine Motor Speed and Accuracy Test) norming dataset and OTW platform data as of April 12, 2026. It covers three clinically relevant patterns: the lifespan trajectory of bilateral hand performance, the use of the Dominant Hand Advantage as a clinical decision-support tool, and the distinct profile of left-handed children. Each section connects findings to supporting literature.

    Data sources: FMSAT norming study (n=284 valid bilateral pairs, ages 3-65, and OT Wizard platform administrations (n=374 T1 clinical referrals, ages 3:0-5:5). Both datasets use the identical tasks: POP_BUBB_10 (H1, dominant hand) and POP_BUBB_11 (H2, non-dominant hand) raw bubble counts. Direct comparison is valid.

    Early Signal 1: The Lifespan Trajectory of Hand Dominance

    What the early data shows

    Dominant hand output (H1) and the gap between hands both increase steadily from preschool through early adulthood, then show a gradual decline in later decades. The non-dominant hand (H2) also grows, but more slowly, meaning the ratio between them widens as lateralization consolidates.

    The FMSAT captures not just how fast a child can perform a fine motor task, but how much further ahead one hand is relative to the other. That asymmetry is the developmental signature we are tracking.

    Figure 1. Lifespan H1/H2 trajectory. Preschool bands (3:0-5:5) from OTW clinical T1 (n=374). School-age and adult bands from FMSAT norming dataset (n=284). Bar length proportional to score out of 80. OTW bands shown in teal; FMSAT bands in purple.

    What the literature says

    Hand dominance consolidation is a normative developmental expectation. Most children show consistent hand preference by age 3 to 4, and a clear functional asymmetry in tool use is established by age 5 (Scharoun and Bryden, 2014; Sacrey et al., 2012). The neurodevelopmental substrate is corpus callosum myelination, which progresses through childhood and is substantially complete by approximately age 10 to 12, consistent with the plateau in bilateral asymmetry observed in our school-age data (Lebel and Beaulieu, 2011).

    Children who have not consolidated hand dominance by kindergarten entry demonstrate effortful, inconsistent tool use and reduced handwriting fluency (Dinehart and Manfra, 2013). From an OT practice perspective, unresolved lateralization is a legitimate basis for eligibility justification and a measurable intervention target. What has been missing is a brief, standardized instrument that can quantify lateralization status directly through behavioral performance.

    Key Citations
    Scharoun and Bryden (2014). Hand preference, performance abilities, and hand selection in children. Frontiers in Psychology, 5, 82.  Lateralization consolidates ages 3-4; unresolved dominance associated with motor difficulty. Sacrey et al. (2012). Precocious hand use preference in reach-to-eat behavior in 1- to 5-year-old children. Developmental Psychobiology, 55(8), 902-911.  Early behavioral lateralization. Dinehart and Manfra (2013). Fine motor skills in preschool associated with academic performance in second grade. Early Education and Development, 24(2), 138-161.  Functional outcome: fine motor to academic connection. Lebel and Beaulieu (2011). Longitudinal development of human brain wiring continues from childhood into adulthood. Journal of Neuroscience, 31(30), 10937-10947.  Corpus callosum myelination timeline.

    Early Signal 2: The Dominant Hand Advantage and Hand Selection

    What the early data shows

    When we examine the ratio of dominant to non-dominant hand output across age bands, children with established hand preferences produce approximately 1.5 to 1.6 times more output with their dominant hand. This ratio is consistent from age 7 through adulthood in typical scorers, suggesting it represents a measurable signature of lateralized motor function that has consolidated fully enough to guide clinical decisions.

    1.6xDominant hand advantage in school-age typical scorers~1 in 5Preschool clinical children with near-equal hands at every age band1.0xTied hands — neither has pulled ahead; hand selection may be premature

    Figure 2:

    Figure 2. Lateralization trajectory by age band. Primary metric: Diff% = (H1-H2)/80×100, a fixed-denominator measure that is stable at all ages including preschool. DHAR (H1/H2 median ratio) shown as secondary reference in Signal column. DHAR mean is not used as it is unstable when H2 scores are low (floor effect in age 3 bands). OTW clinical T1 bands in teal; FMSAT norming bands in purple; adult bands in orange. Signal labels: Emerging / Consolidating / Establishing = pediatric lateralization stages; Stable/Peak, HAROLD Effect, Convergence = adult trajectory signals based on callosal aging literature.

    Clinical application: informing the hand-selection conversation

    Handwriting is motor memory. Every time a person writes a letter, the brain strengthens a specific motor pattern in the hand being used. When a child switches hands, they are building two separate motor programs for every letter — and neither program accumulates enough practice to become automatic. Motor learning research is clear: inconsistency prevents automaticity (Schmidt and Lee, 2011). A child who writes with both hands is essentially a beginner with each hand, never progressing to the automatic stage where handwriting becomes effortless.

    For individuals where the ratio is near 1.0 (tied hands), the FMSAT is equally informative: neither hand has pulled ahead yet. In younger children, this may be developmentally expected. In school-age children where dominance should be established, it becomes a meaningful clinical flag. In either case, recommending one hand prematurely may not be appropriate, and a re-evaluation in a few months is often more defensible than committing to one side before the nervous system has made its own lean. For children with developmental coordination difficulties, the clinical stakes are higher still — their motor learning already takes longer than typical, and asking them to build two sets of motor patterns for every letter makes an already difficult task significantly harder (Missiuna et al., 2008).

    What happens in later adulthood

    The early adult data shows the dominant hand advantage holding relatively steady through the 50s — roughly 1.5x — consistent with the hypothesis that decades of occupational repetition continue to maintain dominant-hand specialization even after neurological myelination is complete (Lebel and Beaulieu, 2011). But in the 60+ age band, early data shows the ratio beginning to narrow toward 1.2x, with the non-dominant hand closing the gap.

    This pattern is consistent with what neuroscience research describes as the HAROLD effect — Hemispheric Asymmetry Reduction in Older Adults (Cabeza, 2002). As the corpus callosum undergoes age-related structural atrophy, particularly in its anterior and middle sections, the interhemispheric inhibition that normally keeps the non-dominant motor cortex suppressed during dominant-hand tasks begins to diminish (Seidler, 2010; Sullivan et al., 2010). The result is increased ipsilateral (non-dominant hemisphere) motor activation during even basic unimanual tasks — effectively reducing the behavioral expression of hemispheric specialization. The FMSAT may be capturing this at the behavioral output level: as callosal integrity declines, H2 closes the gap on H1 not because the dominant hand weakens, but because the inhibitory mechanisms that normally constrain the non-dominant hand are less effective.

    This is directional only at current sample sizes — adults over 60 represent n=5 in this dataset. It is, however, a theoretically coherent and clinically interesting signal that warrants investigation as adult data grows.

    What the literature says

    Key Citations
    Packheiser et al. (2023). Elevated levels of mixed-hand preference in dyslexia: Meta-analyses of 68 studies. Neuroscience and Biobehavioral Reviews, 154, 105420.  OR = 1.57 for mixed-handedness in dyslexia across 68 studies, n > 45,000. Highest-priority lateralization-to-learning-disability citation.Packheiser, Papadatou-Pastou, and Ocklenburg (2025). Handedness in mental and neurodevelopmental disorders: A second-order meta-analysis. Psychological Bulletin.  Association specific to early-onset, language-related neurodevelopmental disorders.Rodriguez (2010). Mixed-handedness is linked to mental health problems in children and adolescents. Pediatrics, 125(2), e340-e348.  N = 7,871, Northern Finland Birth Cohort. ADHD-mixed handedness connection.Missiuna et al. (2008). Recognizing and referring children at risk for developmental coordination disorder. Paediatrics and Child Health, 13(7), 565-570.  Motor learning timeline in DCD populations.Cabeza (2002). Hemispheric asymmetry reduction in older adults: the HAROLD model. Psychological Aging, 17(1), 85-100.  Age-related reduction in hemispheric lateralization in both cognitive and motor tasks; foundational model for adult bilateral convergence.Seidler (2010). Functional implications of age differences in motor system connectivity. Frontiers in Systems Neuroscience, 4, 17.  Older adults recruit ipsilateral motor cortex more during dominant-hand tasks; reduced interhemispheric inhibition via callosal atrophy.Sullivan et al. (2010). Quantitative fiber tracking of lateral and interhemispheric white matter systems in normal aging. Neurobiology of Aging, 31, 464-481.  Corpus callosum structural decline in aging correlates with motor processing speed reduction and reduced interhemispheric communication.

    Early Signal 3: Left-Dominant Individuals Show a Different Profile

    What the early data shows

    Left-dominant individuals across all age groups in the FMSAT dataset show a consistently smaller dominant hand advantage than right-handers. Right-dominant individuals average 1.56x; left-dominant individuals average 1.33x. More strikingly, 42% of left-handed participants show near-equal hands (LI less than 10%), compared to 15% of right-handers. Left-handers also show a higher rate of negative gaps — cases where the non-dominant hand actually outperforms the chosen dominant hand.

    GroupMean DHARNon-Dom Hand %% Near-EqualClinical Signal
    Right-Dominant1.56x67% of H115%Standard reference
    Left-Dominant1.33x79% of H142%Separate norms needed
    Inconsistent~1.1x94% of H133%Flag for follow-up

    Figure 3. Dominant Hand Advantage comparison by handedness group. Right-dominant n=238; Left-dominant n=43 (FMSAT norming dataset). Near-equal defined as LI less than 10%.

    Hypothesis: the right-handed world effect

    Our hypothesis is that left-handed individuals grow up navigating a world built primarily for right-hand use. Scissors, desk surfaces, spiral notebooks, zipper pulls, and most classroom tools are designed for right-hand use. The sustained right-hand exposure required to adapt to these tools may keep the non-dominant right hand more capable than it would otherwise be, slowing the natural divergence between hands.

    Whether this represents adaptive bilateral development — a genuine advantage for left-handers who build broader bilateral motor capacity — or a delayed lateralization signal that warrants clinical attention in referred children is a question this dataset will help answer as it grows. Both interpretations have clinical relevance.

    Practical implication: Do not apply right-hand reference values to left-dominant children. A left-handed child with a dominant hand advantage of 1.3x may be completely age-appropriate. That same ratio in a right-handed child of the same age would be a flag. Separate reference values for left-dominant children are required — and are being developed from this dataset.

    What the literature says

    Key Citations
    Goez and Zelnik (2008). Handedness in patients with developmental coordination disorder. Journal of Child Neurology, 23(2), 151-154.  Elevated left-handedness prevalence in DCD populations.Packheiser et al. (2023). Elevated levels of mixed-hand preference in dyslexia.  See Section 2. Also relevant: OR = 1.57 applies specifically to mixed/inconsistent handedness, not left-handedness per se — an important clinical distinction.

    Where We Are Headed

    These findings are pre-normative and drawn from a predominantly clinical sample. They support the theoretical framework of the FMSAT as a lateralization screening tool but do not yet constitute published norms. The norming project is ongoing, and every submission expands the dataset that will make the reference values in this document defensible for clinical and eventual manuscript use.

  • What a Fine Motor Task Is Teaching Us About Hand Dominance, Development, and the Kids We Serve

    What a Fine Motor Task Is Teaching Us About Hand Dominance, Development, and the Kids We Serve

    If you work with children, you already know that fine motor development is not a single skill. It is a constellation of abilities that unfolds over years, shaped by neurology, practice, environment, and opportunity. What is harder to capture in a clinical setting is the relationship between the two hands, specifically how the dominant and non-dominant hand diverge as laterality develops, and what that divergence tells us about where a child is in their developmental trajectory.

    That is exactly what we set out to examine with the FMSAT, the Fine Motor Speed and Accuracy Test. We are currently in the norming phase of the project, collecting data across age groups, classification types, and settings to build a representative dataset. We do not yet have enough responses to publish normative scores, but the early trends are worth discussing because they are clinically interesting and because they reinforce concepts that developmental science has long described but that practicing clinicians rarely have a quick tool to measure.

    A Quick Overview of the Task

    The FMSAT uses a standardized worksheet placed over a piece of craft foam. The test taker uses a sharpened pencil to puncture a hole in each circle on the worksheet, working through the task one hand at a time. Each hand is timed to 30 seconds. The test taker self-selects which hand to use first, which in most cases is the dominant or preferred hand, and then completes the same task with the opposite hand. This produces two independent scores per session, one for each hand, along with observational data about task comprehension and strategy use.

    The Laterality Arc Is Showing Up in the Data

    One of the most consistent early findings is that younger children score more similarly across both hands, while older children show a progressively larger gap between dominant and non-dominant hand performance. That gap appears to widen through the elementary school years and then stabilize in adulthood.

    This is consistent with what developmental theory tells us about laterality. Hand preference is not fully established in most children until somewhere between ages four and six, and functional dominance, meaning the degree to which the dominant hand has pulled ahead in skill, continues to develop well into middle childhood. What the FMSAT appears to be capturing is the functional expression of that process. The two hands are not just different in preference. They become increasingly different in capability as the dominant hand accumulates practiced, automated movement patterns through activities like writing, drawing, and tool use that the non-dominant hand simply does not experience in the same way.

    The clinical implication is significant. A large gap between the two hands in a seven or eight year old may reflect healthy lateralization. The same pattern in a ten year old whose non-dominant hand is barely functional as a stabilizer is worth examining more closely. And a very small gap in a six year old may not reflect strong bilateral skills. It may reflect that neither hand has yet established the motor memory that comes with consistent, repeated use of one hand over the other.

    Both Hands Are Affected in Children Receiving Services

    Children in our dataset who are receiving or have been referred for occupational therapy, physical therapy, speech, or special education services are scoring lower on both hands compared to peers in general education. Not just the non-dominant hand. Both hands.

    This finding challenges a framing that sometimes creeps into documentation and goal writing, the idea that a child’s dominant hand is functional and the non-dominant hand is the problem. In our early data, the fine motor challenge appears to be more global. The non-dominant hand is not functioning effectively as a stabilizer or assist hand, which has downstream effects on every two-handed task a child encounters throughout their day. Scissor use, keyboard tasks, object manipulation, self-care, and play all require some degree of coordinated bilateral input. When both hands are underperforming, the functional impact extends well beyond what a handwriting goal alone will address.

    Gender Is Not Driving the Scores

    Our early data shows almost no difference between male and female performance on the first hand portion of the assessment, less than one tenth of a point difference in mean scores across the full sample. This is worth noting because many fine motor assessments show higher scores for girls, often attributed to earlier neurological maturation, play preferences that favor fine motor practice, or behavioral compliance during structured testing.

    The FMSAT’s format may be minimizing some of those influences by presenting a novel, motivating task that does not favor previously practiced skills in the same way that pencil and paper writing tasks do. If the gender parity in our data holds as the sample grows, it would support the use of a single normative table for both sexes and strengthen the argument that the assessment is measuring motor capacity rather than motor experience.

    What We Hope This Tool Becomes

    The FMSAT was designed to fill a gap that many clinicians feel but struggle to articulate in documentation, the need for a quick, standardized measure of laterality and bilateral fine motor asymmetry that produces defensible, reportable scores. As the dataset grows, we hope to examine whether FMSAT performance correlates with participation in the occupations that matter most to the children we serve, including keeping up with classroom demands, managing self-care and chores at home, and engaging in the play and peer interactions that require confident, coordinated use of both hands.

    We are also exploring the potential for the FMSAT to serve as a screener within Multi-Tiered Systems of Support frameworks. A brief validated tool that can flag students who may benefit from Tier 2 or Tier 3 fine motor support before a full evaluation is warranted addresses a real gap in how schools identify children with emerging concerns. Paired with a comprehensive evaluation, it could also serve as a progress monitoring tool, giving clinicians a repeatable, objective measure of whether the gap between the two hands is narrowing over time in response to intervention.

    None of this is possible without data. If you are an occupational therapist, COTA, who works with children or adults ages three and up, we invite you to contribute to the norming project. The age bands we need most urgently are the youngest, children ages three through five, where fine motor skill is changing rapidly and even a few months difference in age can reflect meaningfully different developmental profiles. Every submission strengthens the foundation we are building, and the tool we are building is for every child who deserves to have their fine motor profile understood with precision and reported with confidence.

    The application form will close at the deadline

    Sonnet 4.6

  • What We Document vs. What We Actually Need to Know

    What We Document vs. What We Actually Need to Know

    Clinical Takeaways | O.T. Wizard Research Series, Part 1

    By Stephanie Seymore Wick, MSOT, OT/L | Founder and Clinical Architect, O.T. Wizard


    Most pediatric OTs are excellent documenters. We write thorough evaluations, set meaningful goals, and log every session. The paper trail is solid. So why is it so hard to answer the one question that matters most?

    Is this working and if so, how much?

    Not “are we doing the right things?” Not “is this child making progress in a general sense?” The specific question: is this child changing, how fast, and is that fast enough?

    That question turns out to be surprisingly hard to answer with the tools most of us are using.

    The Snapshot Problem

    A standardized evaluation gives you a score at one point in time. A re-evaluation gives you another score. You compare the two and write a narrative about what changed. That is snapshot documentation, and it is useful. It tells you where a child started and where they landed.

    What it does not tell you is anything about the line between those two points.

    When did the change happen? Was progress steady, or did the child plateau for two months and then accelerate? Did a specific intervention approach produce better outcomes than others? Did an attendance gap create a measurable dip? Did the child actually cross a key functional threshold six weeks before the re-evaluation was even scheduled?

    Without structured session-level data linked to domain scores, you simply cannot see any of that. You have two dots. You do not have a trajectory.

    Why This Shows Up Differently in Medical vs. School Settings

    In a medical outpatient practice, the moment this gap becomes visible is usually an authorization request. You are being asked to justify continued services and the strongest argument is quantitative: here is where the child started, here is the rate at which they are improving, and here is where they are projected to land by the end of this period. Without RTI data, you fall back on clinical narrative. Narrative is defensible. It is not the same as a slope.

    In school-based practice, the moment arrives at the IEP table. You are sitting with a team that includes a parent, a classroom teacher, a special educator, and an administrator. They are deciding whether OT services should continue, increase, or be exited. The OT who arrives with a performance slope and a comparison to natural developmental growth is a different professional presence than the one who arrives with quarterly progress notes. Both care about the child. Only one has data that can change a decision.

    Exit recommendations are especially difficult without RTI data. Recommending that a child be exited from OT services is a clinical and ethical judgment call. With measurement data showing that the child has reached functional independence or participation and is maintaining gains without direct support, it becomes a defensible milestone. Without that data, it is an opinion.

    The Plateau Conversation

    Every pediatric OT has been here. A child who was making visible progress has leveled off. The parent is worried. The payer is skeptical. The school team is questioning whether to continue services.

    The problem is that a plateau looks the same on paper whether it is stagnation or consolidation. A child consolidating a new skill at a lower level of support may show no numerical gain for several sessions. That is not failure. It is a normal part of skill acquisition. But without session-level performance data, you cannot show anyone the difference. You can only explain it.

    With structured data, you can show the team exactly when the plateau began, what changed in the child’s routine or support structure around that time, and whether similar plateaus have resolved in this child’s history. That changes the conversation from “we think this is temporary” to “here is what the data shows.”

    What Parents Are Actually Asking

    When a parent asks whether therapy is working, the most honest answer most therapists can give without RTI infrastructure is a clinical impression. That impression may be completely accurate. But it is not the same as showing a parent a graph of their child’s performance over twenty sessions and saying: here is where he started, here is the rate at which he is moving, and here is what we project by the end of this period.

    For school-based OTs, the parent question arrives at the IEP table, in front of an entire team. The quality of your data shapes what parents understand, what they advocate for, and what they accept when the team recommends a service change. That matters.

    The Practical Distinction

    Documentation and measurement are not the same system. They are not competing systems either. They serve different purposes.

    Documentation records what happened, establishes compliance, and communicates clinical reasoning. Measurement tracks rate of change, identifies what conditions produce better performance, and determines whether progress is sufficient.

    Most EHRs were built for the first column. Very few were built for the second. The gap between them is not a failure of clinical intent. It is a gap in infrastructure. EMR’s are typically built by people who are interesting in billing insurance and keeping accounting records. They are not clinical intelligence systems.

    One Finding Worth Noting

    When the O.T. Wizard re-evaluation data was examined, Participation and Executive Functioning showed flat longitudinal profiles compared to the large gains seen in VMI, ADL, and fine motor domains. The initial interpretation might be that OT did not improve those areas. But there is another possibility worth taking seriously: the first evaluation rating in those domains may not have captured authentic baseline behavior. Children often present their best behavior when meeting a new therapist in a structured evaluation setting. By re-evaluation, the novelty has worn off. The rating that looks flat may simply be more accurate.

    That is a question that would not have surfaced without measurement data. It has real implications for how we interpret initial evaluation scores in observation-dependent domains. It is the kind of question that data raises and documentation alone cannot.

    A Few Things to Reflect On

    At re-evaluation, how do you determine the rate at which a child progressed? Can you identify which sessions produced the most meaningful gains? Can you show a parent the slope of improvement over an authorization period? Can you distinguish a true plateau from a reduction in required support?

    If those questions are hard to answer with your current system, the infrastructure gap is real, and it is worth thinking about.

    Parts 2 through 4 of this series will move from problem framing to evidence to practice, including composite clinical vignettes, full dataset patterns, and what RTI infrastructure looks like in day-to-day clinical workflow.


    Disclosures: The author is the Founder and Clinical Architect of O.T. Wizard and has a financial interest in the platform. All data referenced is de-identified clinical data collected through the O.T. Wizard software platform in routine practice.

    About O.T. Wizard: O.T. Wizard is a clinical intelligence system for pediatric occupational therapy professionals. The platform evaluates performance across twelve domains including visual-motor integration, fine motor skills, gross motor skills, praxis, visual perception, executive functioning, activities of daily living, and participation. For more information, visit otwizard.com.


  • Built on Evidence. Proven in Practice. Shoutout to Learning Charms’ Team

    Built on Evidence. Proven in Practice. Shoutout to Learning Charms’ Team

    How 3.8 Years of Systematic Clinical Measurement Demonstrates That Occupational Therapy Works

    Stephanie Seymore Wick, MSOT, OT/L | Founder and Clinical Architect, O.T. Wizard | Learning Charms, Inc., Charlotte, North Carolina

    The Problem With Checklists

    For years, occupational therapists working in early childhood settings were collecting data that told them almost nothing. Checklist-style evaluations produced a snapshot: present or absent, yes or no. They could not tell you whether a child improved. They could not tell you which counties had greater concentrations of developmental need. They could not tell you whether your team’s intervention was moving the needle or whether children were simply getting older.

    That was the reality facing Learning Charms in 2022. We were screening and evaluating large numbers of children across Head Start programs, NC Pre-K classrooms, and community settings throughout North Carolina, and we had nothing meaningful to show for it in terms of trend data, geographic insight, or outcome evidence.

    So I built something.

    From Nothing to 8,509 Screenings and Evaluations

    The FUNdamental Foundations (FF) screener was designed and developed by a managing pediatric occupational therapist with 25+years of clinical experience. It was built as a structured, multi-domain developmental tool designed from the outset to generate analyzable data. It was not designed for publication. It was designed to answer clinical questions: What does this population look like? Where are the gaps? Is what we are doing making a difference?

    Thirty clinicians on the Learning Charms team tested and used each version in the field, providing the real-world feedback that drove every refinement. They made the transition from paper-and-pencil evaluations to digital data entry on a tablet or laptop, mid-session, with children in front of them. That is not a small ask. The early weeks required support with the technology. There were growing pains. The team did it anyway, and they did it without much, if any complaint.

    The FF tool went through two versions, each refined based on team feedback. Version 6 ran from June 2022 through July 2023. Version 7, with improvements including date of birth capture and an updated item structure, ran from August 2023 through May 2025. In late 2025, the practice transitioned to O.T. Wizard, a fully rebuilt clinical intelligence platform designed and built by the same therapist.  O.T. Wizard was built with Rasch psychometric architecture, 15 guided evaluations, and integrated outcome tracking across 12 domains.

    The table below summarizes what 3.8 years of that effort produced.

    Table 1. Clinical Data Collected Across the Full Evidence Ecosystem (2022-2026)

    PlatformPeriodRecordsEvaluationsScreeningsE1-E2 Pairs
    FUNdamental Foundations V6Jun 2022 – Jul 20232,9281,5111,417324
    FUNdamental Foundations V7Aug 2023 – May 20254,9622,3682,594477
    O.T. WizardSep 2025 – Mar 202661961997
    TOTAL3.8 years8,5094,4984,011898

    Note. E1-E2 pairs = children with two complete evaluations allowing pre-to-post comparison. FF V6 pairs are V6-only matches. FF V7 pairs include V7-only and cross-version (V6 E1 to V7 E2) matches. OTW pairs matched by Student_ID. pp = percentage points.

    In total: 8,509 individual assessment records. 4,498 full evaluations. 4,011 developmental screenings. 898 pre-to-post evaluation pairs. Over 245,000 item-level data points. Collected by a single clinical team, through routine practice, over less than four years.

    What the Data Shows: Gains That Exceed Maturation

    The central question in any clinical outcome dataset without a randomized control group is this: how do you know the gains are from intervention and not just from children getting older?

    We address this directly.

    Using cross-sectional developmental data from our own E1 (Initial Evaluation) dataset, we calculated the expected rate of developmental growth per month for each skill area based on age alone. This gives us a maturation baseline specific to this population. We then compared that expected gain to the gains actually observed in children who received OT services between E1 and E2 (Re-evaluation), over a mean interval of 5.4 months.

    The results are consistent across all three measured domains and across both independent datasets.

    Table 2. Observed Gains vs. Expected Maturation Over Mean 5.4-Month Interval (FF n=801 pairs, OTW n=94 pairs)

    ItemFF Observed GainExpected (Maturation)RatioOTW Observed Gain
    Draw a Person (0-4 scale)+1.24 pts+0.39 pts3.2x+1.06 pts
    Functional Pencil Grasp+25.3 pp+9.7 pp2.6x+27.7 pp
    Finger Touching (54-mo milestone)+20.3 pp+11.7 pp1.7xn/a
    Cohen’s d (DAP)0.940.84

    Note. Expected gain calculated from cross-sectional linear regression of E1 scores on age in months using the full FF evaluated dataset. pp = percentage points. Cohen’s d: 0.2 = small, 0.5 = medium, 0.8 = large effect. OTW finger touching item not directly comparable due to different item structure.

    Draw a Person improved at 3.2 times the expected developmental rate in FF and 2.6 times in OTW. Functional pencil grasp improved at 2.6 times expected in FF and 3.1 times in OTW. These are not marginal differences from what maturation alone would predict. They are two to three times larger. And they replicate across an entirely independent dataset collected with a different tool, by the same team, with different children.

    Why This Is Not Just Children Getting Older

    If the gains above were driven primarily by maturation, we would expect children at all starting points to show similar improvement. A child who enters at score 0 would gain roughly as much as a child who enters at score 3, because age-related development does not care where you start.

    That is not what we see. The table below shows Draw a Person gains stratified by E1(Initial Evaluation)  score, combining FF and O.T. Wizard data. The pattern is unambiguous.

    Table 3. Draw a Person Gain by E1 Score: FF (n=801) + OTW (n=93) Combined

    E1 ScorenE2 MeanMean Gain% Improved% Same% Declined
    0 (no parts)365+291.74+1.7474%26%0%
    1 (approximations)203+162.37+1.3781%13%6%
    2 (head, no body)165+312.66+0.6654%37%9%
    3 (recognizable)60+112.96-0.0429%46%25%
    4 (6+ body parts)8+63.36-0.360%57%43%

    Note. n column shows FF count + OTW count at each E1 score level. E1 score 0 = no recognizable approximations. Score 4 = recognizable person with 6 or more body parts. Gains decline systematically as E1 score increases, reflecting ceiling effects at higher starting points rather than absence of progress.

    Children who started at score 0 improved by an average of 1.74 points, with 74% showing measurable gains. Children who started at score 3 or 4 were near the ceiling of the scale and showed flat or slightly negative scores at E2, exactly as ceiling effects predict.

    This score-dependent gain gradient is the signature of a real treatment effect. Maturation produces relatively uniform gains regardless of starting point. Intervention produces the largest gains in children with the most room to grow. That is what we observe, and it replicates point-for-point across both the FF and OTW datasets independently.

    The grasp and finger touching data tell the same story from a different angle.

    Table 4. Skill Transition Rates: What Happened Between E1 and E2

    ItemStatus at E1nOutcome at E2
    Pencil GraspNon-functional377 (FF) + 65 (OTW)60% converted to functional
    Pencil GraspFunctional417 (FF) + 29 (OTW)94% maintained functional
    Finger TouchingFail407 (FF)58% passed at E2
    Finger TouchingPass394 (FF)82% maintained pass

    60% of children with non-functional pencil grasp at E1 had functional grasp by E2. 94% of children with functional grasp at E1 maintained it. Skills were not fluctuating randomly. They were moving in one direction and holding. That is not maturation. That is intervention.

    Two Tools, Three Years Apart, Same Answer

    The FF screener and O.T. Wizard are different instruments. FF was a clinician-developed Google Form with embedded scoring anchors and standardized stimulus materials. O.T. Wizard is a fully architected clinical platform undergoing Rasch psychometric validation, with 596 data variables per evaluation and item-level calibration. The two tools share several core items, including Draw a Person, pencil grasp classification, and finger touching. They do not share overlapping children. The DAP scale is directly comparable across both tools at the 0 to 4 range, with identical scoring anchors at each level. O.T. Wizard extended the ceiling by adding two higher-level descriptors, bringing the OTW scale to 6 points total. For this analysis, OTW DAP scores were capped at 4 to ensure a valid cross-tool comparison.

    Yet when we calculate the cross-sectional developmental growth rate for Draw a Person from FF E1 data, we get 0.072 points per month. From OTW E1 data, we get 0.082 points per month. Two tools, thousands of children, the same underlying developmental trajectory captured within 0.01 points of each other per month.

    When two independent measurement systems produce convergent developmental slopes and convergent gain ratios, that is not a coincidence. That is construct validity. Each dataset serves as an independent replication of the other’s findings, and both point to the same conclusion.

    Danielle, an OTR/L out of NC, administers an evaluation with a 3 year old using OT Wizard

    What This Means for OT Practice and Clinical Infrastructure

    Pediatric occupational therapists have long known that their interventions make a difference. The challenge has been demonstrating it systematically, at scale, in a form that partners, funders, schools, and insurance providers find credible.

    The Learning Charms team built that demonstration over 3.8 years, starting from scratch, with no research funding, no university partnership, and no IRB. They built it by replacing meaningless checklists with structured clinical measurement, by training a team of 30 clinicians to collect data consistently, and by iterating their tools until the data was worth analyzing.

    O.T. Wizard is the current iteration of that infrastructure. It is not a platform claiming efficacy. It is a platform whose evidence base already exists, built by the same team that built the platform, using the same children, in the same communities, over the same years. The data in this paper is not a promise of what O.T. Wizard will eventually show. It is a record of what systematic clinical measurement has already demonstrated.

    OT works. The data, replicated across tools and years and nearly 900 pairs of children, shows it.

    Disclosure

    Stephanie Seymore Wick is the founder and clinical architect of O.T. Wizard and owner of Learning Charms, Inc. All data was collected through routine clinical practice and contracted screening partnerships. No external funding was received. The FUNdamental Foundations screener was a clinician-developed field tool and has not undergone formal psychometric validation. O.T. Wizard is currently undergoing Rasch analysis validation. All findings should be interpreted as practice-based clinical evidence rather than results from a randomized controlled trial.

    About O.T. Wizard

    O.T. Wizard is a clinical intelligence system for pediatric occupational therapy professionals. The platform supports evaluation, documentation, goal planning, and scheduling across 12 domains including fine motor skills, visual-motor integration, praxis, visual perception, executive functioning, activities of daily living, and participation. O.T. Wizard is undergoing Rasch analysis validation to establish psychometrically sound, norm-referenced scoring with living norms that update as the clinical database expands. Learn more at otwizard.com.

    About Learning Charms

    Learning Charms is a pediatric occupational therapy group that employs roughly 25 OTP’s in the Charlotte , NC and surrounding counties. Learning Charms is now focused mainly on preschool aged children in their school environment.

  • What a Brief Scissor Skills Assessment Reveals in Preschool-Aged Children

    What a Brief Scissor Skills Assessment Reveals in Preschool-Aged Children

    More Than a Milestone: What a Brief Scissor Skills Assessment Reveals About Tool Use, Hand Dominance, and Cutting Development in Preschool-Aged Children

    Stephanie Seymore Wick, MSOT, OT/L  |  Founder and Clinical Architect, O.T. Wizard

    March 2026

    Abstract

    Aims: To examine scissor cutting performance across preschool age bands (36 to 65 months) in a clinical sample, identify relationships between cutting accuracy, hand dominance, and hand positioning, assess cross-domain correlations, and evaluate longitudinal progress from initial to re-evaluation.

    Methods: Descriptive and correlational analysis of 541 pediatric occupational therapy evaluations (Age Bands G through J) using structured cutting tasks scored on a standardized 14-point rubric. Participants were children referred for OT services, predominantly ages 48 to 59 months, with at least 90% qualifying for Medicaid.

    Results: Cutting accuracy followed a clear developmental progression across age bands. Thumb-up dominant hand positioning was a large-effect predictor of cutting accuracy (Cohen d=1.17). Established hand dominance and writing-to-scissor hand consistency were strongly associated with performance. Scissor performance correlated significantly with fine motor, visual motor integration, ADL, visual perception, gross motor, bilateral integration, and praxis domains. Longitudinal gains of 5.21 points over 4.8 months exceeded the expected natural growth rate of 1.51 points.

    Conclusions: A structured scissor skills assessment captures clinically meaningful variation in cutting skill and supports response-to-intervention documentation, goal writing, and cross-domain clinical reasoning in pediatric OT practice.

    Keywords: scissor skills, hand dominance, fine motor development, pediatric occupational therapy, response to intervention, preschool

    Scissors are one of the most commonly targeted skills in pediatric occupational therapy, yet they are rarely assessed with the precision required to drive goal writing, track progress, or demonstrate response to intervention. In most clinical settings, a child either can cut or cannot cut. That binary framing misses the developmental story that unfolds across the preschool years and leaves practitioners without the data needed to communicate clinical value to families, educators, and payers.

    The preschool years represent the primary window for scissor skill acquisition. Cutting a straight line with 1-inch tolerance is typically expected by 41 months, precision cutting within a 1/4-inch boundary emerges around 48 months, and smooth curvy-line cutting at a 1/4-inch tolerance is an expectation by 60 months (O.T. Wizard Scissor Skills Assessment, v6.2). Despite this well-established developmental sequence, most standardized pediatric OT assessments address scissor skills with limited granularity, and published outcome data on scissor skill development in referred clinical populations remains sparse.

    This article presents findings from 541 pediatric occupational therapy evaluations collected through O.T. Wizard, a clinical intelligence platform for pediatric occupational therapy professionals. Using a standardized scissor skills assessment embedded within the evaluation process, this analysis examines cutting performance across age bands, its relationship to hand dominance and hand positioning, its correlation with multiple developmental domains, and longitudinal gains across re-evaluation. The evidence supports scissor skill assessment as a window into neuromotor organization, tool use learning, and cross-domain functional development.

    Methods

    Participants

    This analysis includes 541 pediatric occupational therapy evaluations representing children ages 36 through 65 months (Age Bands G through J): Band G (36 to 47 months, n=61), Band H (48 to 53 months, n=199), Band I (54 to 59 months, n=256), and Band J (60 to 65 months, n=69). An additional 82 children had paired evaluations (E1 and E2), with a mean interval of 4.8 months between assessments, enabling longitudinal analysis. The sample was 57% male and 43% female. Primary language was English for 90% of participants and Spanish for 9%. At least 90% of children qualified for Medicaid, and approximately 86% were recommended for OT services following evaluation. All evaluations were conducted in North Carolina.

    Data were collected through routine pediatric occupational therapy evaluations conducted in clinical practice using O.T. Wizard. Parents provided informed consent as part of standard clinical care. As this analysis represents clinical outcomes data rather than human subjects research, institutional review board approval was not required. All data were de-identified in accordance with HIPAA regulations.

    Measures

    The O.T. Wizard Scissor Skills Assessment (v6.2) is a structured, standardized tool embedded within the O.T. Wizard multi-domain pediatric OT evaluation platform. It measures cutting performance across a progression of task demands anchored to published developmental milestones: holding scissors with one hand (24 months), snipping paper (34 months), opening and closing scissors (36 months), cutting a 1-inch straight line (41 months), 3/4-inch and 1/2-inch straight lines (43 and 45 months), a 1/4-inch straight line (48 months), a 1/4-inch curvy line (60 months), and smooth cutting quality (72 months). Cutting accuracy was scored using a standardized rubric with 0, 0.5, and 1.0 point values per segment, yielding a maximum score of 14 points per cutting task. Therapists also documented scissor type used, dominant hand position (thumb up versus thumb down or absent), stabilizer hand description, and qualitative hand positioning ratings.

    This analysis focuses primarily on FM_SCIS_48 (1/4-inch straight line), selected as the primary analytic item due to near-complete data across all age bands (n=541) and its anchor at the 48-month developmental expectation. FM_SCIS_41 (1-inch straight line) and FM_SCIS_60C (1/4-inch curvy line) were included where sample sizes permitted. Scissor type data indicated that 90.6% of children were assessed with school or safety scissors; adaptive equipment (spring-assisted, loop handle) was used in fewer than 1% of cases and is not analyzed separately.

    Data Analysis

    Descriptive statistics were calculated for FM_SCIS_48 by age band, dominance level, and thumb positioning group. Pearson and Spearman correlations were computed between FM_SCIS_48 and all available domain and subdomain scores. Between-group comparisons used independent samples t-tests; effect sizes are reported as Cohen d. Longitudinal analysis used paired t-tests comparing E1 and E2 scores among children with paired evaluations. A cross-sectional growth rate was used to estimate expected natural maturation over the mean evaluation interval, following the methodology established in the response-to-intervention outcomes article in this series. Artificial intelligence writing assistance (Claude, Anthropic, version Sonnet 4.6) was used in the preparation of this manuscript for language editing and formatting; all analytical decisions, clinical interpretations, and conclusions are those of the author.

    All data is pre-normative. Rasch analysis validation is ongoing and will be reported in subsequent publications.

    Results

    Developmental Progression of Cutting Accuracy

    Across all age bands, mean scores on FM_SCIS_48 increased steadily, with the steepest growth occurring between Bands G and H, the window when this skill is developmentally expected to emerge (Table 1). At Band H (the anchor age for this task), 35.6% of children in this clinical sample scored zero, reflecting the referred nature of the population. The bimodal distribution within Band H is more clinically informative than a pass/fail classification. Of 165 children scoring 10 or above on FM_SCIS_48, 162 (98.2%) were also administered FM_SCIS_60C on the same evaluation day. Among children who scored 14 on FM_SCIS_48, scores on FM_SCIS_60C ranged across the full spectrum (mean 8.61), confirming that the curvy task captures a meaningfully more demanding level of motor control.

    Table 1. FM_SCIS_48 (1/4″ straight line) performance by age band. Data from a clinical sample of children referred for OT evaluation, prior to intervention.

    Age BandAge RangenMean /14% ScoreFloor (0)Ceiling (14)
    G36-47m451.7912.8%64.4%2.2%
    H48-53m1804.6433.1%35.6%10.6%
    I54-59m2486.5246.6%18.1%21.4%
    J60-65m688.0757.7%13.2%26.5%

    Hand Positioning and Hand Dominance

    Dominant hand thumb-up positioning was associated with substantially higher cutting performance. Children with thumb-up positioning averaged 8.16 on FM_SCIS_48 compared to 2.74 for children without thumb-up positioning (Cohen d=1.17, p<0.001; median scores 9.0 versus 1.0). Within Band H, 28% of children who scored zero had thumb-up positioning compared to 89% of children who scored 14. No children who scored 14 on FM_SCIS_48 were rated Never for overall hand positioning quality.

    Hand dominance status was consistently associated with cutting performance (Table 2). Children with established dominance scored more than five points higher on average than children with inconsistent dominance. The Spearman correlation between dominance level and FM_SCIS_48 was rho=0.360 (p<0.001). Writing-to-scissor hand consistency produced a large effect: children who used the same hand for writing and cutting averaged 7.06 on FM_SCIS_48 compared to 2.25 for children who used different hands (Cohen d=1.05, p<0.001).

    Table 2. FM_SCIS_48 mean score by documented hand dominance level (Bands G-J, n=534). Dominance level based on therapist rubric rating at time of evaluation.

    Dominance LevelnMean /14% ScoreFloor (scored 0)
    Emerging181.5010.7%56%
    Inconsistent702.3817.0%49%
    Strong preference2335.1736.9%28%
    Established2137.7655.4%16%

    Cross-Domain Correlations

    Scissor cutting performance correlated significantly with all major developmental domain scores (Table 3). Fine Motor domain showed the strongest correlation (r=0.772). Visual Motor Integration (r=0.511) and Visual Perception (r=0.461) correlations reflect the visual guidance demands of cutting within a narrow boundary. The ADL correlation (r=0.511) speaks to generalization of tool use skill across daily living contexts. The Gross Motor correlation (r=0.430) reflects the role of proximal stability as a foundation for distal precision. Praxis showed the weakest correlation (r=0.271), consistent with motor planning contributing primarily to early skill acquisition rather than refined execution. The FMSAT Speed and Accuracy subdomain showed no significant relationship (Spearman rho=-0.012, not significant), confirming that scissor performance and pencil speed capture distinct aspects of fine motor control and contribute independent clinical information.

    Table 3. Pearson and Spearman correlations between FM_SCIS_48 and domain/subdomain scores (Bands G-J). *** p<0.001. FMSAT Spearman correlation not significant.

    Domain / SubdomainnPearson rSpearman rhoClinical Interpretation
    Fine Motor domain4540.772***0.787Strong — cutting as fine motor expression
    Hand Use subdomain5410.541***0.549Bilateral tool use as hand use marker
    Visual Motor Integration5370.511***0.519Visual guidance of cutting path
    ADL domain5100.511***0.530Tool use generalizes to daily living
    Visual Perception domain5150.461***0.469Line discrimination supports accuracy
    Gross Motor domain5400.430***0.444Proximal stability drives distal precision
    Bilateral Integration5380.398***0.395Two-hand coordination demand
    Praxis domain5390.271***0.281Motor planning, weaker once program formed
    Speed & Accuracy (FMSAT)459r=-0.105*rho=-0.012 (ns)Distinct skill; independent clinical value

    Longitudinal Gains

    Among 82 children with paired evaluations, FM_SCIS_48 showed a mean gain of 5.21 points over an average interval of 4.8 months (paired t-test t=8.10, p<0.001; Cohen d=0.895). The curvy task (FM_SCIS_60C) showed a mean gain of 3.75 points over the same interval (t=7.20, p<0.001), with 76.4% of children improving. Using the cross-sectional growth rate as a natural maturation baseline, the expected natural growth on FM_SCIS_48 over 4.8 months was approximately 1.51 points. The observed mean gain of 5.21 points exceeded this expected rate by 3.71 points. Ceiling effects were noted among children who had scored at or near 14 at E1; therapists correctly applied FM_SCIS_60C as the clinically sensitive measure for near-ceiling children in 98.2% of applicable cases.

    Discussion

    This analysis of 541 pediatric OT evaluations demonstrates that a brief, standardized scissor skills assessment generates clinically meaningful data across multiple dimensions of preschool development. The developmental progression of FM_SCIS_48 scores across age bands aligns with published milestone expectations and provides clinical benchmarks for a referred population that are not currently available in the literature. Floor effects in younger bands and the bimodal distribution at the anchor age band reflect the nature of scissor skill acquisition in children referred for OT services, where skill emergence is delayed relative to normative expectations. These distributions support documentation of functional deficit and medical necessity in ways that pass/fail classifications cannot.

    The large effect of thumb-up dominant hand positioning (Cohen d=1.17) elevates hand positioning from a clinical observation to a primary, modifiable intervention target. Establishing correct scissor grip before focusing on path accuracy is supported by the data: children without functional thumb-up positioning have mean scores below three regardless of age band, suggesting that grip orientation is a near-prerequisite for achieving cutting accuracy at the mastery level.

    The relationship between hand dominance and scissor performance connects these findings to a broader literature on neuromotor specialization in the preschool years (Scharoun & Bryden, 2014). A child who has not yet organized a consistent preferred hand for tool use is reflecting an underlying developmental state that affects performance across all tool-based tasks. Writing-to-scissor hand consistency findings have direct implications for school-based practice: addressing hand consistency across classroom tool use activities, not only during designated scissor tasks, is consistent with both the data and motor learning principles and supports IEP goal development that reflects the child’s functional performance across settings.

    The cross-domain correlation profile challenges the framing of scissor skills as an isolated fine motor task. The significant Gross Motor correlation (r=0.430) reinforces that proximal stability, including trunk support and shoulder girdle control, is foundational to distal precision, consistent with developmental neuroscience frameworks (Stoodley, 2016). The VMI and Visual Perception correlations reflect the visual guidance demands of path-following. Intervention plans that address only the distal cutting task without considering foundational postural, visual, and neuromotor systems may produce slower or less durable gains. The absence of a significant FMSAT correlation confirms that scissor accuracy and pencil precision speed are complementary measures rather than redundant ones, and that both contribute independent information to a comprehensive fine motor profile.

    Longitudinal gains of 5.21 points over 4.8 months, exceeding the expected natural growth rate by 3.71 points in a population with limited scissor practice outside of OT sessions, provide meaningful support for OT as a driver of skill development. This above-expected gain pattern is consistent with the RTI methodology established in this article series, which separates natural developmental progress from intervention-attributable change using cross-sectional growth rates as a baseline correction. For medical model practitioners, this framing supports quantifiable medical necessity documentation. For school-based practitioners, it provides data to support RTI tier documentation and progress monitoring language consistent with IDEA requirements.

    Several methodological factors warrant consideration. This sample represents children referred for OT evaluation in North Carolina and should not be generalized to typically developing children or other geographic populations. The cross-sectional age-band comparisons reflect group differences rather than individual trajectories. Adaptive scissor data was insufficient for analysis. Without a controlled comparison group, causal claims about OT effectiveness cannot be made; above-expected gains in a referred population with limited community practice are suggestive but not definitive. Future research should include a typically developing comparison sample, session-level dosage data, and expanded age coverage through early elementary years to determine whether scissor precision continues to develop beyond 66 months and at what point the 1/4-inch straight line becomes a floor item for older children (Cameron et al., 2012; Zhang et al., 2025).

    Conclusions

    A structured scissor skills assessment generates clinically meaningful data for pediatric OT practice. Cutting accuracy in a referred preschool population follows a measurable developmental trajectory, is strongly predicted by thumb-up dominant hand positioning and established hand dominance, correlates significantly with fine motor, gross motor, visual motor, visual perception, ADL, and praxis domains, and shows gains that exceed expected natural growth rates over a 4.8-month evaluation interval in a population with limited community scissor access. These findings support the use of standardized, quantitative scissor skills assessment as a component of comprehensive pediatric OT evaluation and as a practical tool for RTI documentation, goal writing, and cross-domain clinical reasoning in both school-based and medical model practice settings.

    Disclosure of Interest

    Stephanie Seymore Wick is the Founder and Clinical Architect of O.T. Wizard, the platform from which all data in this article was collected. Data collection is ongoing under clinical quality improvement protocols. All data were de-identified in accordance with HIPAA regulations. The author reports no other competing interests.

    Data Availability Statement

    De-identified aggregate data supporting the findings of this study are available from the corresponding author upon reasonable request. Individual-level data cannot be shared due to HIPAA de-identification obligations.

    Biographical Note

    Stephanie Seymore Wick, MSOT, OT/L is the Founder and Clinical Architect of O.T. Wizard, a clinical intelligence platform for pediatric occupational therapy professionals, and the founder of Learning Charms, Inc. Her clinical and research focus is the development of psychometrically sound, computable measurement tools that quantify pediatric OT outcomes across multiple developmental domains. She practices and conducts research in North Carolina.

    References

    Cameron, C. E., Brock, L. L., Murrah, W. M., Bell, L. H., Worzalla, S. L., Grissmer, D., & Morrison, F. J. (2012). Fine motor skills and executive function both contribute to kindergarten achievement. Child Development, 83(4), 1229-1244. https://doi.org/10.1111/j.1467-8624.2012.01768.x

    Scharoun, S. M., & Bryden, P. J. (2014). Hand preference, performance abilities, and hand selection in children. Frontiers in Psychology, 5, 82. https://doi.org/10.3389/fpsyg.2014.00082

    Stoodley, C. J. (2016). The cerebellum and neurodevelopmental disorders. Cerebellum, 15(1), 34-37. https://doi.org/10.1007/s12311-015-0715-3

    Zhang, B.-F., Lin, Z.-C., & Li, C. (2025). Fine motor skills assessment instruments for preschool children with typical development: A scoping review. Frontiers in Psychology, 16, 1620235. https://doi.org/10.3389/fpsyg.2025.1620235