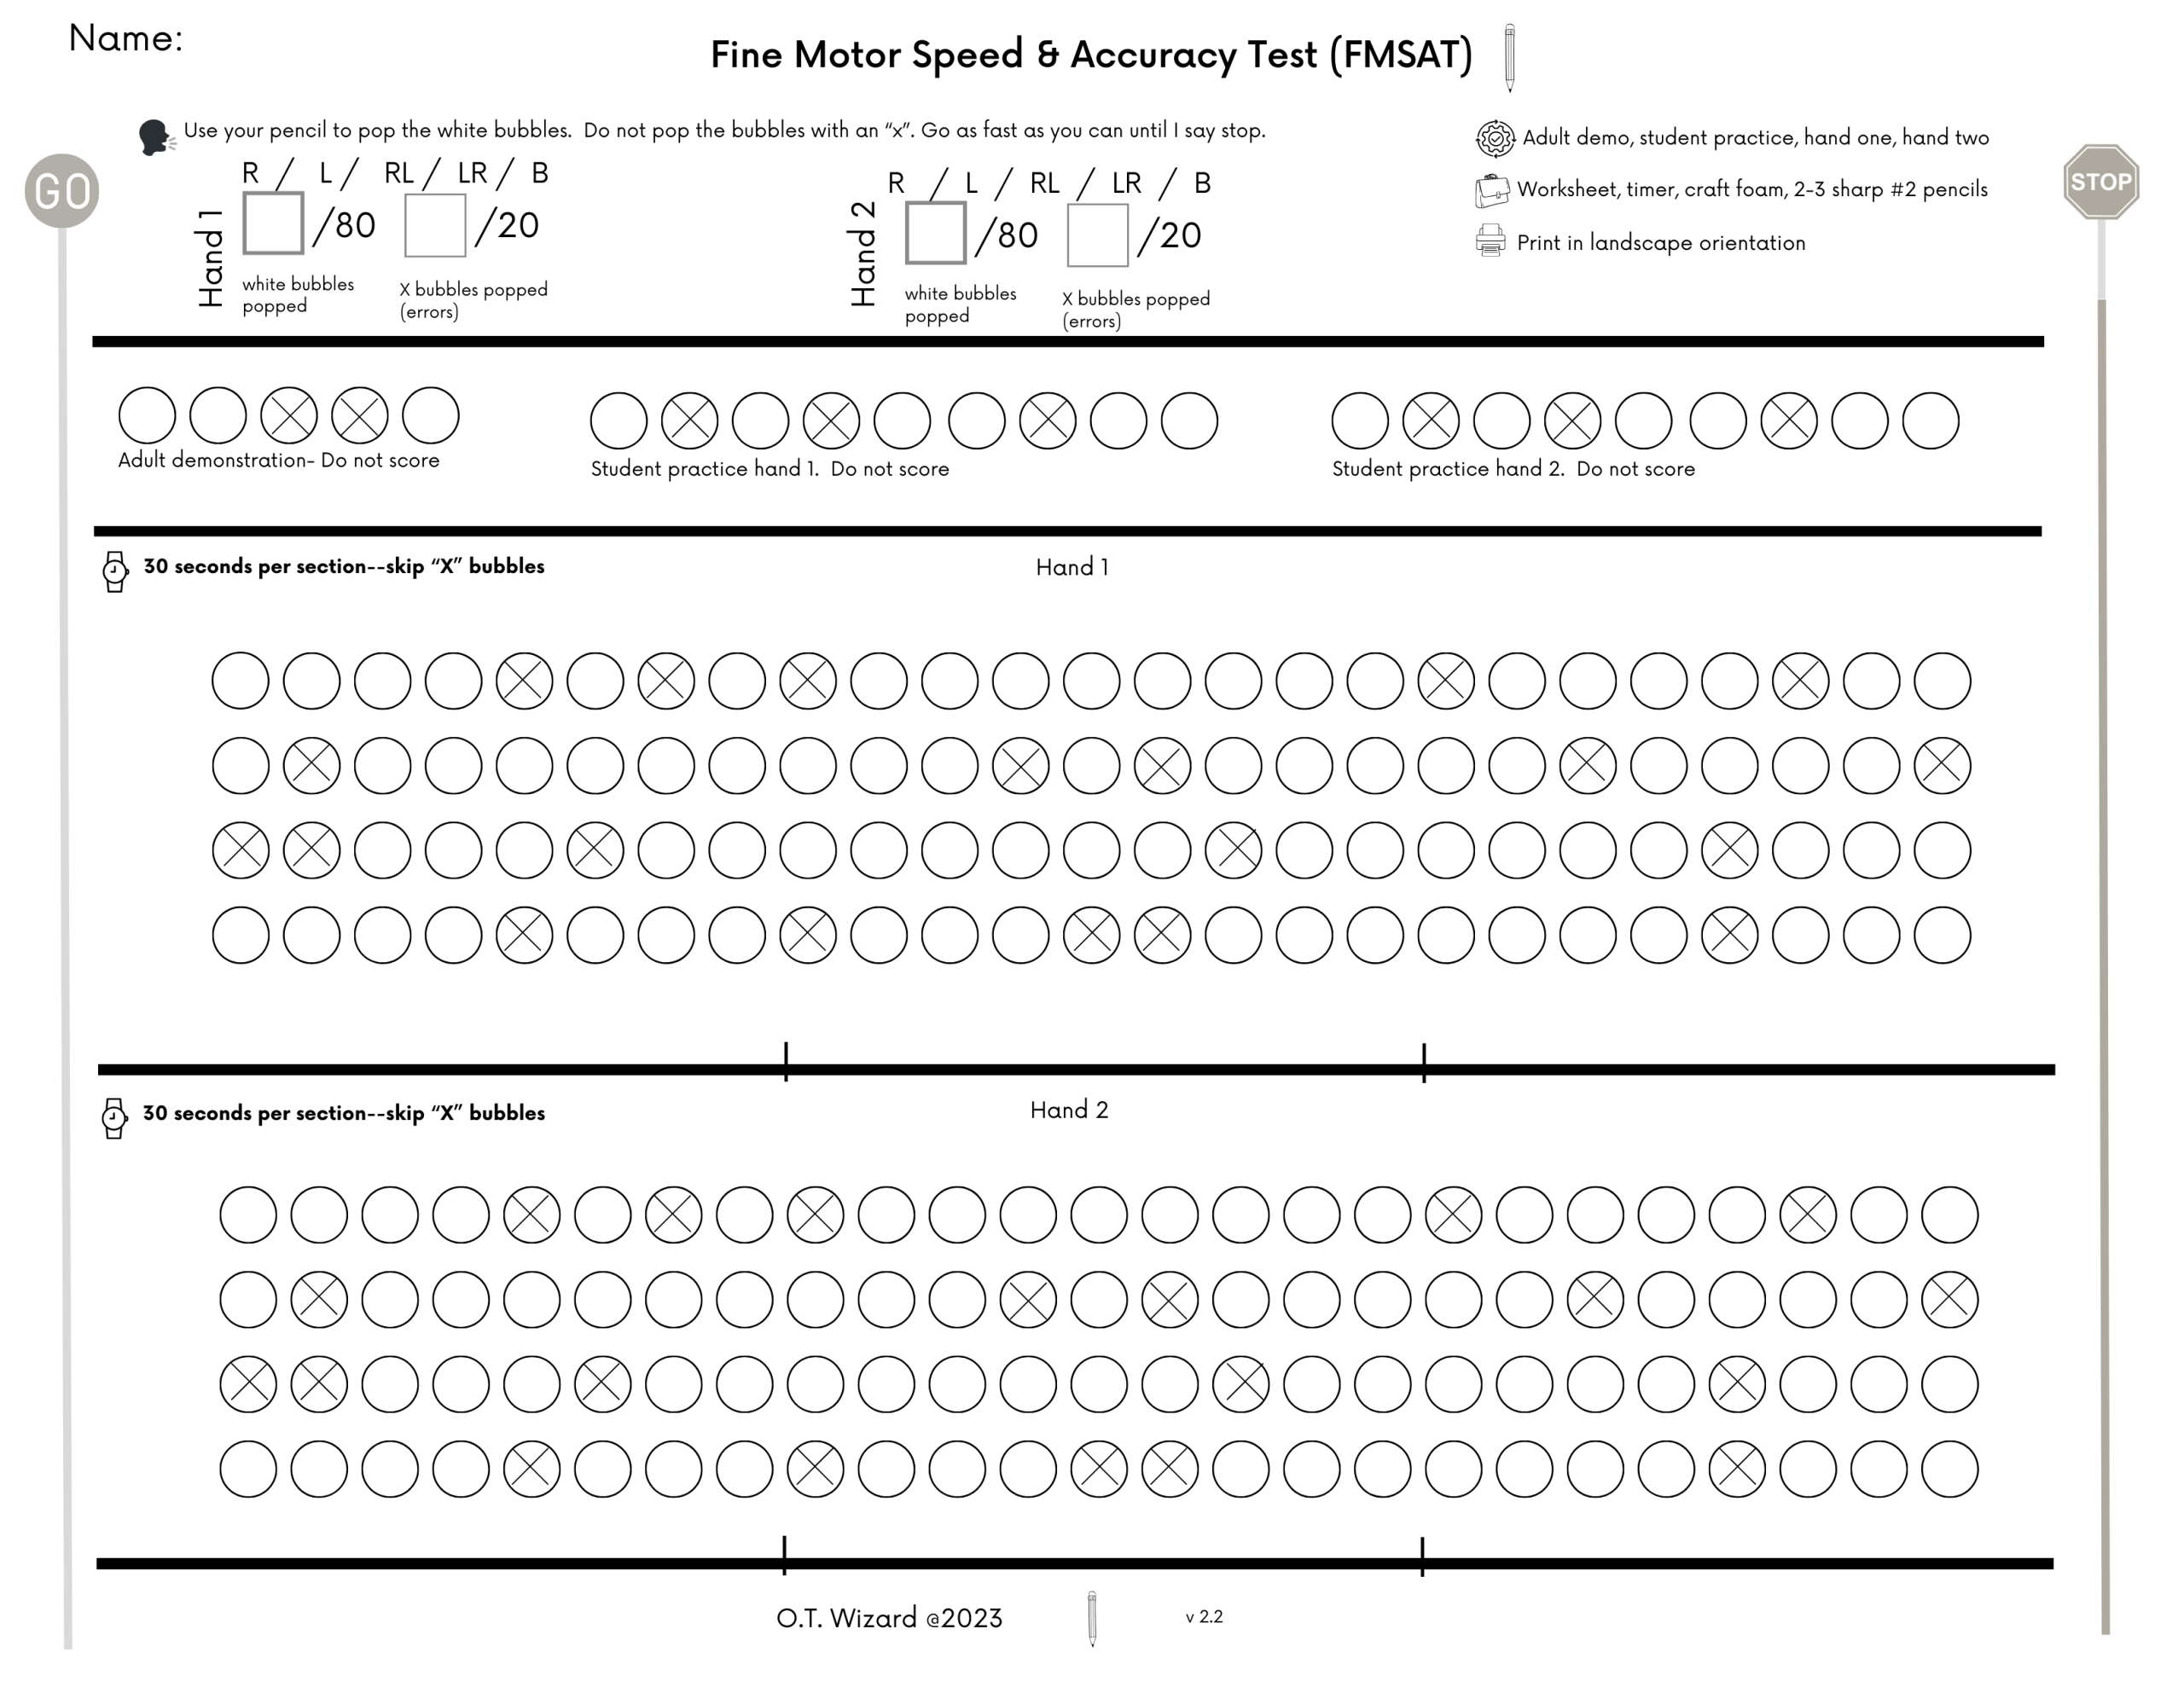
A standardized worksheet with rows of small circles. Thirty seconds per hand. A sharpened pencil. That is the entire assessment.
We call it Fine Motor Speed and Accuracy Test (FMSAT)- because that is where we want the test taker’s attention. But the data is telling us the test is not really about speed at all. It is about which hand the nervous system has committed to, and when, and why some people never fully commit. After more than 1,400 bilateral trials across ages three to seventy-plus, the data is starting to show what this simple task can actually see.
Looking for a Fine Motor Screener
Pediatric and adult OTPs have long needed a brief, standardized, score-based measure that complements clinical observation without replacing it. We built the Fine Motor Speed and Accuracy Test (FMSAT) to fill that gap. But we wanted more than a number. We wanted evidence that the number maps onto the broader clinical picture a skilled clinician already sees.
The correlation picture emerging from our data is that kind of evidence. FMSAT scores are converging with the O.T. Wizard Fine Motor domain score, with related motor domains, and with the overall composite. They are converging with the Fine Motor Participation Rating Scale (FMPRS), our companion clinician observational instrument. And deliberately, we looked outside the O.T. Wizard platform for independent evidence, because self-referential data is not ecological validity.
One number stands out. Ninety-seven percent. That is the rate at which a child’s self-selected first hand on the FMSAT matches the clinician’s independent rating of their grasp hand, captured in the same session. For context, most concurrent validity correlations in pediatric motor assessment literature sit in the .40 to .60 range. A 97% agreement rate between a one-minute task-based score and an independent clinician observation is not ordinary.
O.T. Wizard
O.T. Wizard is a clinical intelligence platform for occupational therapy, built by a working clinician. It is not billing software with clinical documentation bolted on. The architecture runs the other direction. Evaluations produce structured scored data across clinical domains. Plans of care, goals, session measurement, and progress reports compose from that data. The FMSAT is embedded inside the evaluation workflow, which means every FMSAT score sits alongside clinician ratings captured in the same session, by the same clinician. That co-occurrence is what makes this dataset rare and the ecological validity analysis possible.
The FMSAT National Team
Assessment compliance is the quiet killer of norming studies. The FMSAT has mostly solved that problem by accident, because we designed it to be fast, and being fast made it feel like a game. One team member put it this way:
“I find this assessment really easy to administer and the students really like it. I’ve been telling them it’s a game we’re starting with to pop bubbles and they get really excited. One of my students was actually frustrated with me when he didn’t get to go first today LOL.”
The lifespan data is being built by a distributed team of licensed OTPs from school-based and clinic-based settings. Some of our most active therapist researchers to date are: Lauren David, Veronica Sydlowski, Kelly Simiele, Christie LeClair, Meghan Taylor, Jenna Hogan, Kayla Hauck, Chanda Waller, Ronda Horton, Catherine Jones, Meredith Pait, and the full Learning Charms therapy team. The project is IRB-determined as not-human-subjects research (Pearl IRB 2026-0154). A sixty-second administration produces meaningful data on both hands, where Hand One is the test taker’s self-selected first hand and Hand Two is the other.
Combined Lifespan Trends
A developmental trajectory is emerging from the combined data. The gap between Hand One and Hand Two rises through early childhood, peaks in young adulthood, and compresses again in adults sixty and older. One of the patterns that surprised us most is how far that compression goes. In our current data, the Hand One to Hand Two gap in adults in their sixties looks more like the gap in a six-year-old than in a forty-year-old. A one-minute screener appears to be catching the full arc of neuromotor lateralization across the lifespan.
There is a plausible framework for part of this pattern. The HAROLD effect, or Hemispheric Asymmetry Reduction in Older Adults, was first described by Cabeza (2002) and has since been documented in motor performance by Seidler et al. (2010) and Sullivan et al. (2010). The pattern we are seeing in adults sixty and older is consistent with what HAROLD predicts: reduced hemispheric specialization as the brain ages, which would show up on a bilateral motor task as a compressed gap between hands. Our data is early and the sample in this age range is still small. We are not in a position to claim HAROLD replication. We are in a position to say the trend line in our data is pointing where the literature would predict it should point, and we intend to keep collecting.
What It May Be Measuring
The test directs attention toward speed and accuracy. The constructs surfacing in the data are different. Fine motor capability, reflected in the Hand One score. Neuromotor lateralization, reflected in the gap between the two hands. These are separate clinical questions and should not be collapsed into a single number. The X-score, which counts errors on distractor circles the test taker is instructed to skip, appears to capture a third construct entirely: impulse control. That will be its own study.
The Finding That Is Changing How We Build Norms
Left-dominant test takers show about half the asymmetry of right-dominant test takers. We think a lifetime of adapting to right-biased tools, scissors, can openers, computer mice, spiral notebooks, trains the non-dominant hand upward. Whatever the cause, it means the norms we build cannot treat everyone the same way. More to come on that front.
Join the Team
The dataset now spans ages three through seventy-plus, and collection continues. We are specifically seeking OTPs with access to adult populations to join the National Team. We plan to finish the research by mid summer 2026. Contributors are acknowledged by name in the validation work and earn CEUs through the O.T. Wizard platform. If you are interested, reach out: stephanie@learningcharms.com.
Clinical Takeaways | O.T. Wizard Research Series, Part 1
By Stephanie Seymore Wick, MSOT, OT/L | Founder and Clinical Architect, O.T. Wizard
Most pediatric OTs are excellent documenters. We write thorough evaluations, set meaningful goals, and log every session. The paper trail is solid. So why is it so hard to answer the one question that matters most?
Is this workingand if so, how much?
Not “are we doing the right things?” Not “is this child making progress in a general sense?” The specific question: is this child changing, how fast, and is that fast enough?
That question turns out to be surprisingly hard to answer with the tools most of us are using.
The Snapshot Problem
A standardized evaluation gives you a score at one point in time. A re-evaluation gives you another score. You compare the two and write a narrative about what changed. That is snapshot documentation, and it is useful. It tells you where a child started and where they landed.
What it does not tell you is anything about the line between those two points.
When did the change happen? Was progress steady, or did the child plateau for two months and then accelerate? Did a specific intervention approach produce better outcomes than others? Did an attendance gap create a measurable dip? Did the child actually cross a key functional threshold six weeks before the re-evaluation was even scheduled?
Without structured session-level data linked to domain scores, you simply cannot see any of that. You have two dots. You do not have a trajectory.
Why This Shows Up Differently in Medical vs. School Settings
In a medical outpatient practice, the moment this gap becomes visible is usually an authorization request. You are being asked to justify continued services and the strongest argument is quantitative: here is where the child started, here is the rate at which they are improving, and here is where they are projected to land by the end of this period. Without RTI data, you fall back on clinical narrative. Narrative is defensible. It is not the same as a slope.
In school-based practice, the moment arrives at the IEP table. You are sitting with a team that includes a parent, a classroom teacher, a special educator, and an administrator. They are deciding whether OT services should continue, increase, or be exited. The OT who arrives with a performance slope and a comparison to natural developmental growth is a different professional presence than the one who arrives with quarterly progress notes. Both care about the child. Only one has data that can change a decision.
Exit recommendations are especially difficult without RTI data. Recommending that a child be exited from OT services is a clinical and ethical judgment call. With measurement data showing that the child has reached functional independence or participation and is maintaining gains without direct support, it becomes a defensible milestone. Without that data, it is an opinion.
The Plateau Conversation
Every pediatric OT has been here. A child who was making visible progress has leveled off. The parent is worried. The payer is skeptical. The school team is questioning whether to continue services.
The problem is that a plateau looks the same on paper whether it is stagnation or consolidation. A child consolidating a new skill at a lower level of support may show no numerical gain for several sessions. That is not failure. It is a normal part of skill acquisition. But without session-level performance data, you cannot show anyone the difference. You can only explain it.
With structured data, you can show the team exactly when the plateau began, what changed in the child’s routine or support structure around that time, and whether similar plateaus have resolved in this child’s history. That changes the conversation from “we think this is temporary” to “here is what the data shows.”
What Parents Are Actually Asking
When a parent asks whether therapy is working, the most honest answer most therapists can give without RTI infrastructure is a clinical impression. That impression may be completely accurate. But it is not the same as showing a parent a graph of their child’s performance over twenty sessions and saying: here is where he started, here is the rate at which he is moving, and here is what we project by the end of this period.
For school-based OTs, the parent question arrives at the IEP table, in front of an entire team. The quality of your data shapes what parents understand, what they advocate for, and what they accept when the team recommends a service change. That matters.
The Practical Distinction
Documentation and measurement are not the same system. They are not competing systems either. They serve different purposes.
Documentation records what happened, establishes compliance, and communicates clinical reasoning. Measurement tracks rate of change, identifies what conditions produce better performance, and determines whether progress is sufficient.
Most EHRs were built for the first column. Very few were built for the second. The gap between them is not a failure of clinical intent. It is a gap in infrastructure. EMR’s are typically built by people who are interesting in billing insurance and keeping accounting records. They are not clinical intelligence systems.
One Finding Worth Noting
When the O.T. Wizard re-evaluation data was examined, Participation and Executive Functioning showed flat longitudinal profiles compared to the large gains seen in VMI, ADL, and fine motor domains. The initial interpretation might be that OT did not improve those areas. But there is another possibility worth taking seriously: the first evaluation rating in those domains may not have captured authentic baseline behavior. Children often present their best behavior when meeting a new therapist in a structured evaluation setting. By re-evaluation, the novelty has worn off. The rating that looks flat may simply be more accurate.
That is a question that would not have surfaced without measurement data. It has real implications for how we interpret initial evaluation scores in observation-dependent domains. It is the kind of question that data raises and documentation alone cannot.
A Few Things to Reflect On
At re-evaluation, how do you determine the rate at which a child progressed? Can you identify which sessions produced the most meaningful gains? Can you show a parent the slope of improvement over an authorization period? Can you distinguish a true plateau from a reduction in required support?
If those questions are hard to answer with your current system, the infrastructure gap is real, and it is worth thinking about.
Parts 2 through 4 of this series will move from problem framing to evidence to practice, including composite clinical vignettes, full dataset patterns, and what RTI infrastructure looks like in day-to-day clinical workflow.
Disclosures: The author is the Founder and Clinical Architect of O.T. Wizard and has a financial interest in the platform. All data referenced is de-identified clinical data collected through the O.T. Wizard software platform in routine practice.
About O.T. Wizard: O.T. Wizard is a clinical intelligence system for pediatric occupational therapy professionals. The platform evaluates performance across twelve domains including visual-motor integration, fine motor skills, gross motor skills, praxis, visual perception, executive functioning, activities of daily living, and participation. For more information, visit otwizard.com.
How 3.8 Years of Systematic Clinical Measurement Demonstrates That Occupational Therapy Works
Stephanie Seymore Wick, MSOT, OT/L | Founder and Clinical Architect, O.T. Wizard | Learning Charms, Inc., Charlotte, North Carolina
The Problem With Checklists
For years, occupational therapists working in early childhood settings were collecting data that told them almost nothing. Checklist-style evaluations produced a snapshot: present or absent, yes or no. They could not tell you whether a child improved. They could not tell you which counties had greater concentrations of developmental need. They could not tell you whether your team’s intervention was moving the needle or whether children were simply getting older.
That was the reality facing Learning Charms in 2022. We were screening and evaluating large numbers of children across Head Start programs, NC Pre-K classrooms, and community settings throughout North Carolina, and we had nothing meaningful to show for it in terms of trend data, geographic insight, or outcome evidence.
So I built something.
From Nothing to 8,509 Screenings and Evaluations
The FUNdamental Foundations (FF) screener was designed and developed by a managing pediatric occupational therapist with 25+years of clinical experience. It was built as a structured, multi-domain developmental tool designed from the outset to generate analyzable data. It was not designed for publication. It was designed to answer clinical questions: What does this population look like? Where are the gaps? Is what we are doing making a difference?
Thirty clinicians on the Learning Charms team tested and used each version in the field, providing the real-world feedback that drove every refinement. They made the transition from paper-and-pencil evaluations to digital data entry on a tablet or laptop, mid-session, with children in front of them. That is not a small ask. The early weeks required support with the technology. There were growing pains. The team did it anyway, and they did it without much, if any complaint.
The FF tool went through two versions, each refined based on team feedback. Version 6 ran from June 2022 through July 2023. Version 7, with improvements including date of birth capture and an updated item structure, ran from August 2023 through May 2025. In late 2025, the practice transitioned to O.T. Wizard, a fully rebuilt clinical intelligence platform designed and built by the same therapist. O.T. Wizard was built with Rasch psychometric architecture, 15 guided evaluations, and integrated outcome tracking across 12 domains.
The table below summarizes what 3.8 years of that effort produced.
Table 1. Clinical Data Collected Across the Full Evidence Ecosystem (2022-2026)
Platform
Period
Records
Evaluations
Screenings
E1-E2 Pairs
FUNdamental Foundations V6
Jun 2022 – Jul 2023
2,928
1,511
1,417
324
FUNdamental Foundations V7
Aug 2023 – May 2025
4,962
2,368
2,594
477
O.T. Wizard
Sep 2025 – Mar 2026
619
619
—
97
TOTAL
3.8 years
8,509
4,498
4,011
898
Note. E1-E2 pairs = children with two complete evaluations allowing pre-to-post comparison. FF V6 pairs are V6-only matches. FF V7 pairs include V7-only and cross-version (V6 E1 to V7 E2) matches. OTW pairs matched by Student_ID. pp = percentage points.
In total: 8,509 individual assessment records. 4,498 full evaluations. 4,011 developmental screenings. 898 pre-to-post evaluation pairs. Over 245,000 item-level data points. Collected by a single clinical team, through routine practice, over less than four years.
What the Data Shows: Gains That Exceed Maturation
The central question in any clinical outcome dataset without a randomized control group is this: how do you know the gains are from intervention and not just from children getting older?
We address this directly.
Using cross-sectional developmental data from our own E1 (Initial Evaluation) dataset, we calculated the expected rate of developmental growth per month for each skill area based on age alone. This gives us a maturation baseline specific to this population. We then compared that expected gain to the gains actually observed in children who received OT services between E1 and E2 (Re-evaluation), over a mean interval of 5.4 months.
The results are consistent across all three measured domains and across both independent datasets.
Table 2. Observed Gains vs. Expected Maturation Over Mean 5.4-Month Interval (FF n=801 pairs, OTW n=94 pairs)
Item
FF Observed Gain
Expected (Maturation)
Ratio
OTW Observed Gain
Draw a Person (0-4 scale)
+1.24 pts
+0.39 pts
3.2x
+1.06 pts
Functional Pencil Grasp
+25.3 pp
+9.7 pp
2.6x
+27.7 pp
Finger Touching (54-mo milestone)
+20.3 pp
+11.7 pp
1.7x
n/a
Cohen’s d (DAP)
0.94
—
—
0.84
Note. Expected gain calculated from cross-sectional linear regression of E1 scores on age in months using the full FF evaluated dataset. pp = percentage points. Cohen’s d: 0.2 = small, 0.5 = medium, 0.8 = large effect. OTW finger touching item not directly comparable due to different item structure.
Draw a Person improved at 3.2 times the expected developmental rate in FF and 2.6 times in OTW. Functional pencil grasp improved at 2.6 times expected in FF and 3.1 times in OTW. These are not marginal differences from what maturation alone would predict. They are two to three times larger. And they replicate across an entirely independent dataset collected with a different tool, by the same team, with different children.
Why This Is Not Just Children Getting Older
If the gains above were driven primarily by maturation, we would expect children at all starting points to show similar improvement. A child who enters at score 0 would gain roughly as much as a child who enters at score 3, because age-related development does not care where you start.
That is not what we see. The table below shows Draw a Person gains stratified by E1(Initial Evaluation) score, combining FF and O.T. Wizard data. The pattern is unambiguous.
Table 3. Draw a Person Gain by E1 Score: FF (n=801) + OTW (n=93) Combined
E1 Score
n
E2 Mean
Mean Gain
% Improved
% Same
% Declined
0 (no parts)
365+29
1.74
+1.74
74%
26%
0%
1 (approximations)
203+16
2.37
+1.37
81%
13%
6%
2 (head, no body)
165+31
2.66
+0.66
54%
37%
9%
3 (recognizable)
60+11
2.96
-0.04
29%
46%
25%
4 (6+ body parts)
8+6
3.36
-0.36
0%
57%
43%
Note. n column shows FF count + OTW count at each E1 score level. E1 score 0 = no recognizable approximations. Score 4 = recognizable person with 6 or more body parts. Gains decline systematically as E1 score increases, reflecting ceiling effects at higher starting points rather than absence of progress.
Children who started at score 0 improved by an average of 1.74 points, with 74% showing measurable gains. Children who started at score 3 or 4 were near the ceiling of the scale and showed flat or slightly negative scores at E2, exactly as ceiling effects predict.
This score-dependent gain gradient is the signature of a real treatment effect. Maturation produces relatively uniform gains regardless of starting point. Intervention produces the largest gains in children with the most room to grow. That is what we observe, and it replicates point-for-point across both the FF and OTW datasets independently.
The grasp and finger touching data tell the same story from a different angle.
Table 4. Skill Transition Rates: What Happened Between E1 and E2
Item
Status at E1
n
Outcome at E2
Pencil Grasp
Non-functional
377 (FF) + 65 (OTW)
60% converted to functional
Pencil Grasp
Functional
417 (FF) + 29 (OTW)
94% maintained functional
Finger Touching
Fail
407 (FF)
58% passed at E2
Finger Touching
Pass
394 (FF)
82% maintained pass
60% of children with non-functional pencil grasp at E1 had functional grasp by E2. 94% of children with functional grasp at E1 maintained it. Skills were not fluctuating randomly. They were moving in one direction and holding. That is not maturation. That is intervention.
Two Tools, Three Years Apart, Same Answer
The FF screener and O.T. Wizard are different instruments. FF was a clinician-developed Google Form with embedded scoring anchors and standardized stimulus materials. O.T. Wizard is a fully architected clinical platform undergoing Rasch psychometric validation, with 596 data variables per evaluation and item-level calibration. The two tools share several core items, including Draw a Person, pencil grasp classification, and finger touching. They do not share overlapping children. The DAP scale is directly comparable across both tools at the 0 to 4 range, with identical scoring anchors at each level. O.T. Wizard extended the ceiling by adding two higher-level descriptors, bringing the OTW scale to 6 points total. For this analysis, OTW DAP scores were capped at 4 to ensure a valid cross-tool comparison.
Yet when we calculate the cross-sectional developmental growth rate for Draw a Person from FF E1 data, we get 0.072 points per month. From OTW E1 data, we get 0.082 points per month. Two tools, thousands of children, the same underlying developmental trajectory captured within 0.01 points of each other per month.
When two independent measurement systems produce convergent developmental slopes and convergent gain ratios, that is not a coincidence. That is construct validity. Each dataset serves as an independent replication of the other’s findings, and both point to the same conclusion.
Danielle, an OTR/L out of NC, administers an evaluation with a 3 year old using OT Wizard
What This Means for OT Practice and Clinical Infrastructure
Pediatric occupational therapists have long known that their interventions make a difference. The challenge has been demonstrating it systematically, at scale, in a form that partners, funders, schools, and insurance providers find credible.
The Learning Charms team built that demonstration over 3.8 years, starting from scratch, with no research funding, no university partnership, and no IRB. They built it by replacing meaningless checklists with structured clinical measurement, by training a team of 30 clinicians to collect data consistently, and by iterating their tools until the data was worth analyzing.
O.T. Wizard is the current iteration of that infrastructure. It is not a platform claiming efficacy. It is a platform whose evidence base already exists, built by the same team that built the platform, using the same children, in the same communities, over the same years. The data in this paper is not a promise of what O.T. Wizard will eventually show. It is a record of what systematic clinical measurement has already demonstrated.
OT works. The data, replicated across tools and years and nearly 900 pairs of children, shows it.
Disclosure
Stephanie Seymore Wick is the founder and clinical architect of O.T. Wizard and owner of Learning Charms, Inc. All data was collected through routine clinical practice and contracted screening partnerships. No external funding was received. The FUNdamental Foundations screener was a clinician-developed field tool and has not undergone formal psychometric validation. O.T. Wizard is currently undergoing Rasch analysis validation. All findings should be interpreted as practice-based clinical evidence rather than results from a randomized controlled trial.
About O.T. Wizard
O.T. Wizard is a clinical intelligence system for pediatric occupational therapy professionals. The platform supports evaluation, documentation, goal planning, and scheduling across 12 domains including fine motor skills, visual-motor integration, praxis, visual perception, executive functioning, activities of daily living, and participation. O.T. Wizard is undergoing Rasch analysis validation to establish psychometrically sound, norm-referenced scoring with living norms that update as the clinical database expands. Learn more at otwizard.com.
About Learning Charms
Learning Charms is a pediatric occupational therapy group that employs roughly 25 OTP’s in the Charlotte , NC and surrounding counties. Learning Charms is now focused mainly on preschool aged children in their school environment.
More Than a Milestone: What a Brief Scissor Skills Assessment Reveals About Tool Use, Hand Dominance, and Cutting Development in Preschool-Aged Children
Aims: To examine scissor cutting performance across preschool age bands (36 to 65 months) in a clinical sample, identify relationships between cutting accuracy, hand dominance, and hand positioning, assess cross-domain correlations, and evaluate longitudinal progress from initial to re-evaluation.
Methods: Descriptive and correlational analysis of 541 pediatric occupational therapy evaluations (Age Bands G through J) using structured cutting tasks scored on a standardized 14-point rubric. Participants were children referred for OT services, predominantly ages 48 to 59 months, with at least 90% qualifying for Medicaid.
Results: Cutting accuracy followed a clear developmental progression across age bands. Thumb-up dominant hand positioning was a large-effect predictor of cutting accuracy (Cohen d=1.17). Established hand dominance and writing-to-scissor hand consistency were strongly associated with performance. Scissor performance correlated significantly with fine motor, visual motor integration, ADL, visual perception, gross motor, bilateral integration, and praxis domains. Longitudinal gains of 5.21 points over 4.8 months exceeded the expected natural growth rate of 1.51 points.
Conclusions: A structured scissor skills assessment captures clinically meaningful variation in cutting skill and supports response-to-intervention documentation, goal writing, and cross-domain clinical reasoning in pediatric OT practice.
Keywords: scissor skills, hand dominance, fine motor development, pediatric occupational therapy, response to intervention, preschool
Scissors are one of the most commonly targeted skills in pediatric occupational therapy, yet they are rarely assessed with the precision required to drive goal writing, track progress, or demonstrate response to intervention. In most clinical settings, a child either can cut or cannot cut. That binary framing misses the developmental story that unfolds across the preschool years and leaves practitioners without the data needed to communicate clinical value to families, educators, and payers.
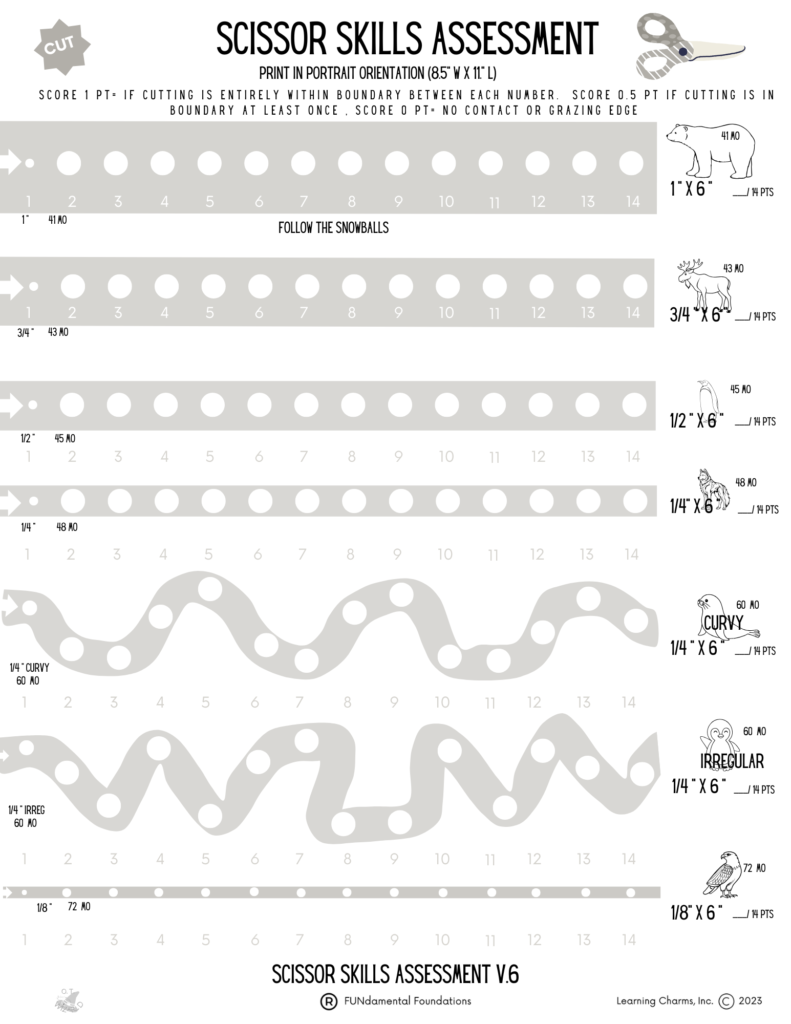
The preschool years represent the primary window for scissor skill acquisition. Cutting a straight line with 1-inch tolerance is typically expected by 41 months, precision cutting within a 1/4-inch boundary emerges around 48 months, and smooth curvy-line cutting at a 1/4-inch tolerance is an expectation by 60 months (O.T. Wizard Scissor Skills Assessment, v6.2). Despite this well-established developmental sequence, most standardized pediatric OT assessments address scissor skills with limited granularity, and published outcome data on scissor skill development in referred clinical populations remains sparse.
This article presents findings from 541 pediatric occupational therapy evaluations collected through O.T. Wizard, a clinical intelligence platform for pediatric occupational therapy professionals. Using a standardized scissor skills assessment embedded within the evaluation process, this analysis examines cutting performance across age bands, its relationship to hand dominance and hand positioning, its correlation with multiple developmental domains, and longitudinal gains across re-evaluation. The evidence supports scissor skill assessment as a window into neuromotor organization, tool use learning, and cross-domain functional development.
Methods
Participants
This analysis includes 541 pediatric occupational therapy evaluations representing children ages 36 through 65 months (Age Bands G through J): Band G (36 to 47 months, n=61), Band H (48 to 53 months, n=199), Band I (54 to 59 months, n=256), and Band J (60 to 65 months, n=69). An additional 82 children had paired evaluations (E1 and E2), with a mean interval of 4.8 months between assessments, enabling longitudinal analysis. The sample was 57% male and 43% female. Primary language was English for 90% of participants and Spanish for 9%. At least 90% of children qualified for Medicaid, and approximately 86% were recommended for OT services following evaluation. All evaluations were conducted in North Carolina.
Data were collected through routine pediatric occupational therapy evaluations conducted in clinical practice using O.T. Wizard. Parents provided informed consent as part of standard clinical care. As this analysis represents clinical outcomes data rather than human subjects research, institutional review board approval was not required. All data were de-identified in accordance with HIPAA regulations.
Measures
The O.T. Wizard Scissor Skills Assessment (v6.2) is a structured, standardized tool embedded within the O.T. Wizard multi-domain pediatric OT evaluation platform. It measures cutting performance across a progression of task demands anchored to published developmental milestones: holding scissors with one hand (24 months), snipping paper (34 months), opening and closing scissors (36 months), cutting a 1-inch straight line (41 months), 3/4-inch and 1/2-inch straight lines (43 and 45 months), a 1/4-inch straight line (48 months), a 1/4-inch curvy line (60 months), and smooth cutting quality (72 months). Cutting accuracy was scored using a standardized rubric with 0, 0.5, and 1.0 point values per segment, yielding a maximum score of 14 points per cutting task. Therapists also documented scissor type used, dominant hand position (thumb up versus thumb down or absent), stabilizer hand description, and qualitative hand positioning ratings.
This analysis focuses primarily on FM_SCIS_48 (1/4-inch straight line), selected as the primary analytic item due to near-complete data across all age bands (n=541) and its anchor at the 48-month developmental expectation. FM_SCIS_41 (1-inch straight line) and FM_SCIS_60C (1/4-inch curvy line) were included where sample sizes permitted. Scissor type data indicated that 90.6% of children were assessed with school or safety scissors; adaptive equipment (spring-assisted, loop handle) was used in fewer than 1% of cases and is not analyzed separately.
Data Analysis
Descriptive statistics were calculated for FM_SCIS_48 by age band, dominance level, and thumb positioning group. Pearson and Spearman correlations were computed between FM_SCIS_48 and all available domain and subdomain scores. Between-group comparisons used independent samples t-tests; effect sizes are reported as Cohen d. Longitudinal analysis used paired t-tests comparing E1 and E2 scores among children with paired evaluations. A cross-sectional growth rate was used to estimate expected natural maturation over the mean evaluation interval, following the methodology established in the response-to-intervention outcomes article in this series. Artificial intelligence writing assistance (Claude, Anthropic, version Sonnet 4.6) was used in the preparation of this manuscript for language editing and formatting; all analytical decisions, clinical interpretations, and conclusions are those of the author.
All data is pre-normative. Rasch analysis validation is ongoing and will be reported in subsequent publications.
Results
Developmental Progression of Cutting Accuracy
Across all age bands, mean scores on FM_SCIS_48 increased steadily, with the steepest growth occurring between Bands G and H, the window when this skill is developmentally expected to emerge (Table 1). At Band H (the anchor age for this task), 35.6% of children in this clinical sample scored zero, reflecting the referred nature of the population. The bimodal distribution within Band H is more clinically informative than a pass/fail classification. Of 165 children scoring 10 or above on FM_SCIS_48, 162 (98.2%) were also administered FM_SCIS_60C on the same evaluation day. Among children who scored 14 on FM_SCIS_48, scores on FM_SCIS_60C ranged across the full spectrum (mean 8.61), confirming that the curvy task captures a meaningfully more demanding level of motor control.
Table 1. FM_SCIS_48 (1/4″ straight line) performance by age band. Data from a clinical sample of children referred for OT evaluation, prior to intervention.
Age Band
Age Range
n
Mean /14
% Score
Floor (0)
Ceiling (14)
G
36-47m
45
1.79
12.8%
64.4%
2.2%
H
48-53m
180
4.64
33.1%
35.6%
10.6%
I
54-59m
248
6.52
46.6%
18.1%
21.4%
J
60-65m
68
8.07
57.7%
13.2%
26.5%
Hand Positioning and Hand Dominance
Dominant hand thumb-up positioning was associated with substantially higher cutting performance. Children with thumb-up positioning averaged 8.16 on FM_SCIS_48 compared to 2.74 for children without thumb-up positioning (Cohen d=1.17, p<0.001; median scores 9.0 versus 1.0). Within Band H, 28% of children who scored zero had thumb-up positioning compared to 89% of children who scored 14. No children who scored 14 on FM_SCIS_48 were rated Never for overall hand positioning quality.
Hand dominance status was consistently associated with cutting performance (Table 2). Children with established dominance scored more than five points higher on average than children with inconsistent dominance. The Spearman correlation between dominance level and FM_SCIS_48 was rho=0.360 (p<0.001). Writing-to-scissor hand consistency produced a large effect: children who used the same hand for writing and cutting averaged 7.06 on FM_SCIS_48 compared to 2.25 for children who used different hands (Cohen d=1.05, p<0.001).
Table 2. FM_SCIS_48 mean score by documented hand dominance level (Bands G-J, n=534). Dominance level based on therapist rubric rating at time of evaluation.
Dominance Level
n
Mean /14
% Score
Floor (scored 0)
Emerging
18
1.50
10.7%
56%
Inconsistent
70
2.38
17.0%
49%
Strong preference
233
5.17
36.9%
28%
Established
213
7.76
55.4%
16%
Cross-Domain Correlations
Scissor cutting performance correlated significantly with all major developmental domain scores (Table 3). Fine Motor domain showed the strongest correlation (r=0.772). Visual Motor Integration (r=0.511) and Visual Perception (r=0.461) correlations reflect the visual guidance demands of cutting within a narrow boundary. The ADL correlation (r=0.511) speaks to generalization of tool use skill across daily living contexts. The Gross Motor correlation (r=0.430) reflects the role of proximal stability as a foundation for distal precision. Praxis showed the weakest correlation (r=0.271), consistent with motor planning contributing primarily to early skill acquisition rather than refined execution. The FMSAT Speed and Accuracy subdomain showed no significant relationship (Spearman rho=-0.012, not significant), confirming that scissor performance and pencil speed capture distinct aspects of fine motor control and contribute independent clinical information.
Table 3. Pearson and Spearman correlations between FM_SCIS_48 and domain/subdomain scores (Bands G-J). *** p<0.001. FMSAT Spearman correlation not significant.
Domain / Subdomain
n
Pearson r
Spearman rho
Clinical Interpretation
Fine Motor domain
454
0.772***
0.787
Strong — cutting as fine motor expression
Hand Use subdomain
541
0.541***
0.549
Bilateral tool use as hand use marker
Visual Motor Integration
537
0.511***
0.519
Visual guidance of cutting path
ADL domain
510
0.511***
0.530
Tool use generalizes to daily living
Visual Perception domain
515
0.461***
0.469
Line discrimination supports accuracy
Gross Motor domain
540
0.430***
0.444
Proximal stability drives distal precision
Bilateral Integration
538
0.398***
0.395
Two-hand coordination demand
Praxis domain
539
0.271***
0.281
Motor planning, weaker once program formed
Speed & Accuracy (FMSAT)
459
r=-0.105*
rho=-0.012 (ns)
Distinct skill; independent clinical value
Longitudinal Gains
Among 82 children with paired evaluations, FM_SCIS_48 showed a mean gain of 5.21 points over an average interval of 4.8 months (paired t-test t=8.10, p<0.001; Cohen d=0.895). The curvy task (FM_SCIS_60C) showed a mean gain of 3.75 points over the same interval (t=7.20, p<0.001), with 76.4% of children improving. Using the cross-sectional growth rate as a natural maturation baseline, the expected natural growth on FM_SCIS_48 over 4.8 months was approximately 1.51 points. The observed mean gain of 5.21 points exceeded this expected rate by 3.71 points. Ceiling effects were noted among children who had scored at or near 14 at E1; therapists correctly applied FM_SCIS_60C as the clinically sensitive measure for near-ceiling children in 98.2% of applicable cases.
Discussion
This analysis of 541 pediatric OT evaluations demonstrates that a brief, standardized scissor skills assessment generates clinically meaningful data across multiple dimensions of preschool development. The developmental progression of FM_SCIS_48 scores across age bands aligns with published milestone expectations and provides clinical benchmarks for a referred population that are not currently available in the literature. Floor effects in younger bands and the bimodal distribution at the anchor age band reflect the nature of scissor skill acquisition in children referred for OT services, where skill emergence is delayed relative to normative expectations. These distributions support documentation of functional deficit and medical necessity in ways that pass/fail classifications cannot.
The large effect of thumb-up dominant hand positioning (Cohen d=1.17) elevates hand positioning from a clinical observation to a primary, modifiable intervention target. Establishing correct scissor grip before focusing on path accuracy is supported by the data: children without functional thumb-up positioning have mean scores below three regardless of age band, suggesting that grip orientation is a near-prerequisite for achieving cutting accuracy at the mastery level.
The relationship between hand dominance and scissor performance connects these findings to a broader literature on neuromotor specialization in the preschool years (Scharoun & Bryden, 2014). A child who has not yet organized a consistent preferred hand for tool use is reflecting an underlying developmental state that affects performance across all tool-based tasks. Writing-to-scissor hand consistency findings have direct implications for school-based practice: addressing hand consistency across classroom tool use activities, not only during designated scissor tasks, is consistent with both the data and motor learning principles and supports IEP goal development that reflects the child’s functional performance across settings.
The cross-domain correlation profile challenges the framing of scissor skills as an isolated fine motor task. The significant Gross Motor correlation (r=0.430) reinforces that proximal stability, including trunk support and shoulder girdle control, is foundational to distal precision, consistent with developmental neuroscience frameworks (Stoodley, 2016). The VMI and Visual Perception correlations reflect the visual guidance demands of path-following. Intervention plans that address only the distal cutting task without considering foundational postural, visual, and neuromotor systems may produce slower or less durable gains. The absence of a significant FMSAT correlation confirms that scissor accuracy and pencil precision speed are complementary measures rather than redundant ones, and that both contribute independent information to a comprehensive fine motor profile.
Longitudinal gains of 5.21 points over 4.8 months, exceeding the expected natural growth rate by 3.71 points in a population with limited scissor practice outside of OT sessions, provide meaningful support for OT as a driver of skill development. This above-expected gain pattern is consistent with the RTI methodology established in this article series, which separates natural developmental progress from intervention-attributable change using cross-sectional growth rates as a baseline correction. For medical model practitioners, this framing supports quantifiable medical necessity documentation. For school-based practitioners, it provides data to support RTI tier documentation and progress monitoring language consistent with IDEA requirements.
Several methodological factors warrant consideration. This sample represents children referred for OT evaluation in North Carolina and should not be generalized to typically developing children or other geographic populations. The cross-sectional age-band comparisons reflect group differences rather than individual trajectories. Adaptive scissor data was insufficient for analysis. Without a controlled comparison group, causal claims about OT effectiveness cannot be made; above-expected gains in a referred population with limited community practice are suggestive but not definitive. Future research should include a typically developing comparison sample, session-level dosage data, and expanded age coverage through early elementary years to determine whether scissor precision continues to develop beyond 66 months and at what point the 1/4-inch straight line becomes a floor item for older children (Cameron et al., 2012; Zhang et al., 2025).
Conclusions
A structured scissor skills assessment generates clinically meaningful data for pediatric OT practice. Cutting accuracy in a referred preschool population follows a measurable developmental trajectory, is strongly predicted by thumb-up dominant hand positioning and established hand dominance, correlates significantly with fine motor, gross motor, visual motor, visual perception, ADL, and praxis domains, and shows gains that exceed expected natural growth rates over a 4.8-month evaluation interval in a population with limited community scissor access. These findings support the use of standardized, quantitative scissor skills assessment as a component of comprehensive pediatric OT evaluation and as a practical tool for RTI documentation, goal writing, and cross-domain clinical reasoning in both school-based and medical model practice settings.
Disclosure of Interest
Stephanie Seymore Wick is the Founder and Clinical Architect of O.T. Wizard, the platform from which all data in this article was collected. Data collection is ongoing under clinical quality improvement protocols. All data were de-identified in accordance with HIPAA regulations. The author reports no other competing interests.
Data Availability Statement
De-identified aggregate data supporting the findings of this study are available from the corresponding author upon reasonable request. Individual-level data cannot be shared due to HIPAA de-identification obligations.
Biographical Note
Stephanie Seymore Wick, MSOT, OT/L is the Founder and Clinical Architect of O.T. Wizard, a clinical intelligence platform for pediatric occupational therapy professionals, and the founder of Learning Charms, Inc. Her clinical and research focus is the development of psychometrically sound, computable measurement tools that quantify pediatric OT outcomes across multiple developmental domains. She practices and conducts research in North Carolina.
References
Cameron, C. E., Brock, L. L., Murrah, W. M., Bell, L. H., Worzalla, S. L., Grissmer, D., & Morrison, F. J. (2012). Fine motor skills and executive function both contribute to kindergarten achievement. Child Development, 83(4), 1229-1244. https://doi.org/10.1111/j.1467-8624.2012.01768.x
Scharoun, S. M., & Bryden, P. J. (2014). Hand preference, performance abilities, and hand selection in children. Frontiers in Psychology, 5, 82. https://doi.org/10.3389/fpsyg.2014.00082
Stoodley, C. J. (2016). The cerebellum and neurodevelopmental disorders. Cerebellum, 15(1), 34-37. https://doi.org/10.1007/s12311-015-0715-3
Zhang, B.-F., Lin, Z.-C., & Li, C. (2025). Fine motor skills assessment instruments for preschool children with typical development: A scoping review. Frontiers in Psychology, 16, 1620235. https://doi.org/10.3389/fpsyg.2025.1620235
We Have Always Known Scissor Skills Matter. Now We Have the Numbers.
You already know scissor skills are more than a craft milestone. You know a child who cannot hold scissors with thumb up, who switches hands mid-cut, or who can barely score a line with school scissors is telling you something important about their neuromotor development. What we have not always had is the data to say exactly what they are telling us, and to show that picture to the families, teachers, and payers who need to understand it.
That is what this analysis is about.
O.T. Wizard collected structured scissor skills assessment data across 541 pediatric OT evaluations from preschool-aged children (ages 3 to 5 and a half) in North Carolina. At least 90% of children qualified for Medicaid. All were referred for OT services after failing a developmental screening. For many, OT sessions were the primary or only setting where scissors were regularly available. Teachers limit scissor time in large classroom groups. Parents restrict use at home. That context matters a lot when we look at what the data shows.
What We Measured
The O.T. Wizard Scissor Skills Assessment is a structured, scored tool built into the evaluation process. It uses a developmental progression of cutting tasks, from snipping (around 34 months) through cutting a 1/4-inch straight line (around 48 months) to cutting a 1/4-inch curvy line (around 60 months). Each task is scored on a 0 to 14 point scale using a consistent segment-by-segment rubric. Therapists also document thumb orientation, stabilizer hand, and overall hand positioning quality.
Unlike a standardized evaluation tool that captures a single snapshot in one domain, O.T. Wizard tracks performance across twelve domains simultaneously including fine motor, gross motor, visual motor integration, visual perception, activities of daily living, praxis, and executive functioning. This is what made the findings below possible. We were not just looking at how a child cuts. We were looking at what scissor skill tells us about the rest of the child.
What We Found
Scissor skill development follows a clear developmental path, and most 4-year-olds referred for OT are not yet where we would expect.
All data in this table reflects first evaluations (E1) conducted before OT intervention began. These are the starting points, the picture of where children arrived for their first evaluation. On the 1/4-inch straight line task (developmentally anchored at 48 months), here is how children in this clinical sample performed at initial evaluation:
Age Group
Avg Score /14
% Accurate
Scored Zero (0/14)
Scored Perfectly (14/14)
3:0 to 3:11 (Band G)
1.8
13%
64%
2%
4:0 to 4:5 (Band H)
4.6
33%
36%
11%
4:6 to 4:11 (Band I)
6.5
47%
18%
21%
5:0 to 5:5 (Band J)
8.1
58%
13%
27%
Table 1. Scissor skills performance on 1/4-inch straight line task at first evaluation (E1), before OT intervention. Clinical sample referred for OT evaluation. Data from O.T. Wizard, pre-normative.
At the anchor age for this task, 36% of children arrived at their first evaluation scoring zero on the 1/4-inch straight line, and another 21% scored between 1 and 3 out of 14. That means that at initial evaluation, before OT had even begun, the majority of 4-year-olds referred for services could not yet cut a 1/4-inch line with any consistency. That is not a failure of intervention. That is a description of who we serve and why they need us. And now we can describe it precisely, in numbers, instead of writing “emerging scissor skills” in a narrative.
These are clinical benchmarks for a referred population, not norms for typically developing children. They show where our kids start. That starting point is worth documenting and measuring.
The multi-task design works. Advancing to harder tasks captures the full range of scissor skill ability.
A common concern with developmental assessments is ceiling effects: what happens when a child is too skilled for the task in front of them? The data confirmed that therapists in this sample handled this correctly. Of children who scored 10 or higher on the 1/4-inch straight line task, 98% were also given the curvy line task on the same evaluation day. Among children who scored a perfect 14 on the straight line, the curvy line scores ranged across the full spectrum, averaging 8.6 out of 14 (61% accuracy). The harder task captured real, meaningful variation that the straight line task could not.
Group
n
Straight Line Avg /14
Straight Line % Accurate
Curvy Line Avg /14
Curvy Line % Accurate
Scored 10+ on straight line
165
12.5
89%
6.8
49%
Scored 14 on straight line
90
14.0
100%
8.6
61%
Table 2. Curvy line performance among children approaching or reaching ceiling on the straight line task. Confirms that advancing to the harder task captures meaningful clinical variation.
Thumb up is not just a cue. It is the difference between scissor skills and not having them.
This was the strongest predictor in the entire dataset. Hand positioning was not just associated with better cutting accuracy. It was associated with a more than 3-fold difference in performance.
Thumb Positioning
n
Avg Score /14
% Accurate
Median Score /14
Thumb-up (correct)
~270
8.2
59%
9.0
Not thumb-up
~270
2.7
19%
1.0
Table 3. Scissor skills performance by dominant hand thumb positioning. Bands G through J. Cohen d=1.17 (large effect).
Looking at Band H children specifically: among those who scored a perfect 14 on the 1/4-inch line, 89% had correct thumb-up positioning. Among those who scored zero, only 28% did. Not a single child at zero had positioning rated as “always” correct. The positioning is not the finishing touch on scissor skill development. It is the prerequisite.
For intervention planning, this data strongly supports prioritizing grip and hand orientation before focusing on line-following accuracy. Therapists who have structured treatment this way have been right all along. Now there are numbers to back it up, and to share with families and IEP teams.
Hand dominance predicts scissor skill accuracy, and the connection runs deeper than which hand holds the scissors.
Children with established hand dominance performed dramatically better on the cutting task than children with inconsistent or emerging dominance. The data below reflects all children in Bands G through J at initial evaluation.
Dominance Level
n
Avg Score /14
% Accurate
% Scored Zero
Emerging
18
1.5
11%
56%
Inconsistent
70
2.4
17%
49%
Strong preference
233
5.2
37%
28%
Established
213
7.8
56%
16%
Table 4. Scissor skills performance by documented hand dominance level at initial evaluation. Spearman rho=0.360, p<0.001.
The hand consistency finding was equally striking. Children who used the same hand for both writing and cutting averaged 7.1 out of 14 (51% accuracy). Children who used different hands for writing versus cutting averaged only 2.3 out of 14 (16% accuracy). That is a more than 3-fold performance gap, and it connects directly to the Hand Dominance article in this series.
A child who switches hands between writing and cutting is not just making an inconsistent tool choice. They are reflecting an unresolved neuromotor organization question that affects all tool use tasks. For school-based OTs, this is IEP-relevant data. Documenting hand consistency across writing and cutting tasks as part of the evaluation supports accommodation planning for the full classroom day, not just during scissor activities.
Scissor skills are a whole-body skill. The domain correlation data proves it.
This is where O.T. Wizard’s multi-domain approach made findings possible that are simply not achievable with a single standardized assessment tool that only looks at one domain or captures a single point in time.
Cutting performance was correlated against every other domain scored in the same evaluation. Here is the picture that emerged:
Domain
Correlation with Scissor Skills Score
What This Means Clinically
Fine Motor
Strong (r=0.77)
Expected: distal precision underlies cutting
Visual Motor Integration
Moderate (r=0.51)
Visual guidance is needed to follow a line
ADL (Daily Living)
Moderate (r=0.51)
Tool use skill generalizes across daily tasks
Visual Perception
Moderate (r=0.46)
Seeing and interpreting the line drives cutting accuracy
Gross Motor
Moderate (r=0.43)
Trunk and shoulder stability support distal hand control
Bilateral Integration
Moderate (r=0.40)
Confirmed: cutting is a two-handed coordinated task
Praxis
Weak-moderate (r=0.27)
Motor planning matters early; less so once the program is established
FMSAT (Fine Motor Speed and Accuracy Test)
Near zero (r=0.00)
Pencil speed and cutting accuracy are distinct skills
Table 5. Correlations between scissor skills performance (1/4-inch straight line) and O.T. Wizard domain scores. All correlations p<0.001 except FMSAT which was not significant. Bands G through J, n=454 to 541 depending on domain.
The gross motor correlation deserves a specific callout. Cutting is a distal fine motor task, but proximal stability drives distal precision. Trunk support and shoulder girdle control provide the foundation from which hand precision is expressed. A child with poor postural stability will have reduced arm control, which directly limits how precisely they can guide scissors along a line. This is the body-supports-hand principle that experienced OTs understand clinically. This dataset quantifies it.
The FMSAT finding is equally important in a different way. FMSAT “Bubble-popping” measures open-field pencil speed and precision. Scissor skills assessment measures controlled path-following with a bilateral tool. These two tasks draw on related but distinct aspects of fine motor function, and both contribute independent clinical information. Having both in the same evaluation is not redundancy. It is clinical depth.
This is the kind of cross-domain picture you cannot build from a BOT-2 or a Beery VMI alone. Those tools give you a score in an isolated domain. O.T. Wizard gives you a developmental profile across twelve domains, from the same child, on the same day, every time you complete an evaluation.
Children Made Real Progress, and OT Likely Drove Most of It.
Among the 97 children with two evaluations on file, those with scissor skills data at both time points showed an average gain of 5.2 points on the 1/4-inch straight line over an average of 4.8 months between evaluations. Nearly 70% showed improvement. However, not all of the sample had scissor related goals on their plan of care.
Measure
E1 (Before OT)
E2 (After ~5 months OT)
Gain
% Who Improved
Avg score /14 (straight line)
4.4 / 14
9.6 / 14
+5.2 pts
69.5%
% Accuracy
31%
69%
+38 pts
Avg score /14 (curvy line)
2.5 / 14
6.2 / 14
+3.8 pts
76.4%
% Accuracy (curvy)
18%
44%
+27 pts
Table 6. Scissor skills gains from initial evaluation (E1) to re-evaluation (E2). n=82 for straight line, n=72 for curvy line. Mean interval 4.8 months. Clinical sample referred for OT services.
Based on cross-sectional growth data, we would expect natural developmental growth of about 1.5 points over a 4.8-month window. These children gained 5.2 points. That is 3.7 points above the expected natural rate, representing more than triple the growth that maturation alone would predict.
And remember the context: these children were largely practicing scissor skills only during OT sessions. Teachers avoid large-group scissor time. Parents restrict home use. If nearly all scissor practice was happening in OT, and children gained more than three times the expected natural growth rate, that is meaningful evidence for OT-driven outcomes, even without a randomized controlled trial.
For school-based and medical model OTs alike, this is the kind of data that supports medical necessity, justifies continuation of services, and answers the parent question: Is this working?
What Makes This Different From a Standard Evaluation
Standardized tools like the BOT-2, PDMS-3, or Beery VMI are valuable. They are not being replaced. But they have a structural limitation: they capture performance in isolated domains, on a single day, at a single point in time. They cannot show how a child’s scissor skills score connects to their gross motor stability or ADL function. They cannot track how a child changes from evaluation to re-evaluation. And they cannot build a growing evidence base across hundreds of children that gets more precise over time.
O.T. Wizard was designed to do all of those things. Every evaluation adds to the clinical intelligence base. Scissor skills scores sit alongside fine motor, gross motor, visual perception, ADL, VMI, praxis, executive functioning, and participation data from the same child on the same day. The cross-domain correlations in this article were only possible because the platform was built to be computable, not just documentable.
This is the difference between documenting therapy and understanding it.
What This Means for Your Practice
If you work in a school setting: Scissor skills accuracy scores contextualized within a developmental progression give you IEP-ready language. A score of 4.6 out of 14 at Band H is not just “emerging” and is a measurable starting point with room to define a meaningful, achievable goal. The hand consistency finding connects directly to classroom accommodations: if a child switches hands between writing and cutting tasks, that is relevant accommodation data for the IEP team, not just a therapy note.
If you work in a medical model setting: The 5.2-point average gain over 4.8 months, in a population with almost no between-session scissor exposure, supports medical necessity documentation with concrete numbers. The cross-domain correlations support a whole-child framing in your evaluation report: scissor skills difficulty is not just a fine motor problem. It reflects neuromotor organization, visual guidance, postural stability, and bilateral coordination working together.
For both settings: Thumb-up hand positioning is the most actionable clinical target in the dataset. If thumb orientation is not being documented and targeted as a prerequisite for cutting accuracy, this data makes the case for starting there.
Scissor Skills Are the Child’s Story
A pair of scissors in a preschooler’s hand is a window. It shows you how well the brain has organized a preferred side, how the trunk is supporting the arms, how the eyes are guiding the hands, and how much the child has internalized the motor program for this specific tool. It is one of the richest clinical observations we make, and one of the least quantified.
That is changing. Data from over 500 evaluations now gives us a picture of what scissor skill development looks like in the children we actually serve, what predicts success, what domains are implicated, and what progress looks like over time. This is the beginning of an evidence base that the profession has needed.
Stephanie Seymore Wick is the Founder and Clinical Architect of O.T. Wizard, the platform from which all data in this article was collected. Data collection is ongoing under clinical quality improvement protocols. All data has been de-identified in accordance with HIPAA regulations.
About O.T. Wizard
O.T. Wizard is a clinical intelligence system for pediatric occupational therapy professionals. The platform evaluates performance in evaluations, forms, and daily treatment notes across twelve domains including visual-motor integration, fine motor skills, gross motor skills, praxis, visual perception, executive functioning, activities of daily living, and participation. O.T. Wizard is undergoing Rasch analysis validation to establish psychometrically sound, norm-referenced scoring with living norms that update continuously as the clinical database expands. Learn more at otwizard.com.
A data-based look at executive functioning during OT evaluations
Occupational therapy practitioners often hear some version of the same question: “They seemed to do fine with you. Why are they struggling so much in class?”
To explore this, we examined therapist-rated Executive Functioning collected during one-on-one OT evaluations with preschoolers. These ratings reflect how children worked with the therapist during the evaluation itself, not how they function in classrooms, group settings, or home environments.
This article focuses on what the data shows and how therapists can interpret these observations responsibly.
Important context about this sample
Children were referred for OT after failing an occupational therapy screening
400+ preschoolers aged 4:0-4:11 , with about equal % of males and females
This is a clinically referred preschool sample, not a normative group
Ratings reflect performance during a one-on-one OT evaluation
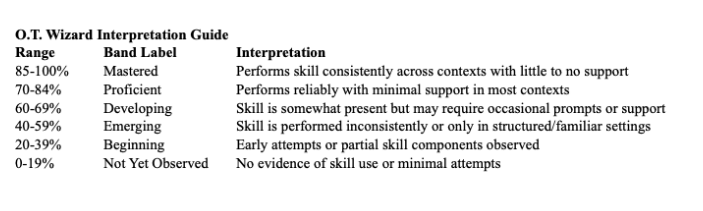
Work habits were rated using descriptive anchors:
Not present or Beginning
Inconsistent or Emerging
Developing
Proficient
Mastered
What the work habit data shows overall
Across all work habit areas, most children in this referred preschool sample were rated in the Developing to Adequate range when working one-on-one with an occupational therapist.
This suggests that many children who struggle in classrooms or group environments are able to participate meaningfully when demands are reduced, expectations are clear, and adult support is individualized.
How children performed across specific work habit areas
Transitions and cooperation
Most children were rated as Developing or Proficient in their ability to transition between activities and cooperate with the therapist during the evaluation.
This indicates that many preschoolers can adapt well to structured tasks when the environment is predictable and supportive, even if transitions are difficult in other settings.
Task initiation and task completion
Task initiation and task completion were commonly rated in the Developing to Proficient range.
Many children required prompting or encouragement to begin tasks, but were generally able to complete them once engaged. This reflects emerging executive functioning skills rather than refusal or lack of effort.
Impulse control and task persistence
Impulse control and task persistence tended to fall in the Developing range.
Children often attempted tasks and remained engaged for short periods but had difficulty sustaining effort across multiple activities. This pattern is typical in preschoolers and becomes more pronounced when task demands increase.
Attention during the evaluation
Attention was the most commonly impacted work habit, even in a one-on-one setting.
Many children were rated between Emerging and Developing for attention. This is an important clinical signal.
When a child struggles to attend during a one-on-one evaluation, they will generally struggle even more in larger, less structured settings such as classrooms, group activities, or busy home environments. Difficulty sustaining attention in a low-demand context often predicts greater challenges when environmental demands increase.
When poor evaluation performance reflects anxiety, not ability
It is also important to acknowledge that not all low work habit ratings reflect true functional ability.
Some preschoolers perform poorly during evaluations because they are:
Nervous
Anxious
Overwhelmed by unfamiliar adults or environments
Uncertain about expectations
In these cases, performance may underestimate a child’s true skills.
Occupational therapists play a critical role in distinguishing between skill limitations and emotional readiness. Establishing rapport is not optional. It is a clinical necessity.
For some children, establishing rapport may include:
Spending additional time building trust
Allowing the child to observe before participating
Using play or preferred activities to reduce anxiety
Delaying formal evaluation tasks until the child appears comfortable with the therapist
Evaluation data is only as meaningful as the context in which it is collected.
What this tells us about one-on-one OT evaluations in our 400+ preschool sample
Taken together, these findings suggest:
Most preschoolers in this referred sample can demonstrate Developing to Adequate work habits in a one-on-one OT evaluation
Stronger performance in this setting does not negate difficulties in classrooms or group environments
Attention difficulties observed in one-on-one contexts often signal more significant challenges in larger settings
Anxiety and lack of rapport can temporarily suppress performance and must be considered during interpretation
Why this matters for interpretation and communication
These data support a critical clinical message:
Performance in a one-on-one OT evaluation reflects what a child can do with individualized support, not what they are expected to manage independently in more complex environments.
When communicating results to families, teachers, and teams, it is essential to clarify the difference between supported performance and real-world participation demands.
Key takeaway for therapists
Based on therapist-rated work habit descriptors:
Most preschoolers in this referred sample demonstrated Developing to Adequate work habits during a one-on-one OT evaluation, while attention and self-regulation remained vulnerable areas, particularly when demands increase or anxiety is present.
This reinforces the importance of careful interpretation, thoughtful rapport building, and contextualized clinical judgment.
📣OTPs : Does this match your experience when evaluating preschoolers? Leave us a comment and let us know.
From time to time, we invite occupational therapists whose use of OT Wizard reflects strong clinical reasoning, real-world application, and thoughtful feedback to participate in a spotlight. These OTP’s have earned their wizard hats.
Meet Krystal Watkins, MS, OTR/L, ADSCS
Can you tell us a little about your background as an OTP, and your work setting(s) ?
I am an Occupational Therapy Practitioner with 8.5 years of experience working across a wide range of settings. My background includes skilled nursing facilities (SNF), acute care, outpatient therapy, early intervention, home health, and school-based practice, which has given me a strong clinical foundation. Over time, my passion has increasingly focused on pediatric practice, particularly working with children with autism and ADHD in educational and community-based settings. I enjoy supporting students’ sensory processing, self-regulation, attention, and functional participation to help them succeed in their daily routines at school and home. I am eager to continue growing professionally and look forward to pursuing additional certifications related to ADHD to further strengthen my ability to support this population.
Do you have a favorite domain or type of challenge you enjoy treating most? What do you love about it?
My favorite domain to work in is supporting students with autism and ADHD in school-based settings. What I love most about this work is how meaningful and practical it is. I enjoy helping students build the regulation, attention, sensory processing, and executive functioning skills they need to participate successfully in their daily school routines. Every child is different, and I find it rewarding to problem-solve creatively whether that means adapting the environment, using sensory-based strategies, or breaking tasks down so a student can experience success. I’m especially passionate about empowering students to better understand their own needs and strengths while collaborating closely with teachers and families. Seeing a child gain confidence, independence, and improved participation in the classroom even through small but significant gains is what makes this work so fulfilling for me.
What does a “normal” day look like for you?
As a school-based occupational therapist, a “normal” day is a balance of planning, direct treatment, and collaboration. I typically start my day by treatment planning and organizing materials to prepare for the students on my caseload. Throughout the day, I provide direct OT services to students, working on goals related to sensory regulation, fine motor skills, executive functioning, and classroom participation. In addition to treatment sessions, I regularly conduct evaluations and re-evaluations, complete documentation, and adjust intervention plans as needed. Collaboration is a key part of my daily routine. I spend time communicating with teachers, support staff, and other members of the school team to problem solve strategies and ensure consistency across environments. Each day is busy and varied, but the mix of hands on work, planning, and teamwork makes the role both dynamic and rewarding.
How did you hear about OT Wizard?
I heard about OT Wizard through a COTA friend who shared their experience and recommended it to Rockingham County Schools.
Before subscribing to OT Wizard, what made you hesitant about trying OT Wizard?
I wasn’t hesitant at all. I was actually excited to try something new and explore a tool that could support my work as an OT.
What made you feel OT Wizard could work in your setting(s)?
I felt OT Wizard could work well in my school-based OT setting because it provides practical resources and tools that directly support my work with students. Having access to ready to use evaluations helps me save planning time, stay organized, and tailor therapy to each child’s needs. It integrates seamlessly into a busy school day, where balancing evaluations, direct therapy, and collaboration with teachers is essential.
Was there a moment where OT Wizard really “clicked” for you?
Yes, there was a moment where OT Wizard really “clicked” for me when I realized how much time it could save on planning and documentation. I was able to quickly pull a ready to use evaluation and immediately tailor it for a student, all while feeling confident that it was thorough and appropriate.
How has OT Wizard changed your approach to evaluations or reports now, even in small ways?
Yes, It allows me to focus more on interpreting results and planning meaningful interventions rather than spending excessive time formatting or creating forms. Overall, it’s made the process more efficient, thorough, and less stressful, so I can dedicate more energy to supporting my students.
What is your favorite feature in OT Wizard?
My favorite features in OT Wizard are the Magic W.A.N.D. and the occupational profile section in the guided evaluations. The Magic W.A.N.D helps assess and identify writing difficulties. The Magic W.A.N.D. gives clear, structured insight into a student’s writing challenges. The occupational profile offers self-reflection type of questions that engage students in their own progress and provide valuable information about their perspectives, strengths, and needs. Both features make evaluations more interactive and meaningful.
What would you say to another OTP who’s feeling hesitant or skeptical about trying OT Wizard?
Give it a try! OT Wizard is designed to make your work easier, more organized, and more student-centered. The ready to use evaluations, tools, and resources save planning time and help you focus on what really matters which is supporting your students’ progress.
What’s one thing you don’t miss doing since using OT Wizard?
I don’t miss spending hours creating and formatting evaluation forms and reports from scratch. With ready to use templates and tools, I can focus on interpreting results and planning interventions instead of getting bogged down in paperwork. It’s been a huge time-saver and stress-reliever!
In addition to what Krystal shared here, she has been a beta tester of both OT Wizard v1 and v2, demonstrating flexibility and patience as the platform evolved. Throughout that process, she consistently showed curiosity and a willingness to learn new technology in service of her clinical work. For these reasons, this OT Wizard hat is well deserved.