Value-Based Care Is Coming for Therapy. Here’s What It Means — and Why Some Practices Are Already Ready.
A significant document landed this week. AOTA, APTA, and ASHA — the three largest therapy professional associations in the country — released a joint publication:Value-Based Care for Therapy: A Provider’s Guide. When three associations that rarely agree on anything publish something together, it is worth paying attention to.
This post is for occupational therapists, physical therapists, speech-language pathologists, mental health professionals, and the practice owners who employ them. Whether you work in a clinic, a school, a hospital, or private practice — this shift is coming for you.
What Is Value-Based Care, and Why Does It Matter Now?
For decades, therapy has been paid under a fee-for-service model. You provide a service, you bill a code, you get paid. Volume drives revenue. The system rewards doing more, not necessarily achieving more.
Value-based care flips that model. Under VBC, payment is tied to the value of care delivered, meaning the outcomes achieved relative to the cost of achieving them. Payers want evidence that patients improved, that care was efficient, and that therapy dollars produced measurable functional change.
CMS has stated formally that by 2030, all Medicare plans and most Medicaid plans will include accountability for quality and total cost of care.
And for anyone thinking this is only a Medicare issue, it is not. Commercial payers historically follow Medicare and Medicaid, typically within two to five years of federal adoption.Plans such as United Healthcare, Blue Cross, Aetna, United, and Cigna watch the federal model and build similar requirements into their own contracts. This is an incoming reality for your entire payer mix, regardless of the population you serve.
What Will Payers Actually Require — and How Will They Get the Data?
This is where it gets specific, and where most therapy providers are underprepared.
Under value-based care contracts, payers will not rely solely on claims data. They will aggregate multiple data streams to generate a risk-adjusted performance score for each provider. That score determines reimbursement rates, bonus eligibility, penalty exposure, and increasingly — prior authorization requirements.
The data sources payers will draw from include diagnostic codes, functional status scores at evaluation and discharge, episode length, caregiver and patient-reported outcome measures, and social determinants of health. Together, these paint a picture of who your patients are, how complex their needs are, and whether your billed intervention produced meaningful change.
The risk adjustment piece deserves particular attention. Payers use a system called Hierarchical Condition Categories (HCC) to score the complexity of a provider’s caseload. The formula looks at diagnosis codes to predict how difficult and costly a patient’s care should be. The intent is fairness: a practice treating children with complex medical histories and significant functional deficits should not be benchmarked against a practice treating mild developmental delays.
But here is the problem. If your documentation does not accurately capture patient complexity (ex: if your evaluations are narrative rather than structured, if diagnoses are under coded, if functional deficits are described rather than measured by metrics) the HCC formula underestimates your caseload. Your practice looks like it is treating simpler patients than it is. Your performance scores suffer. Your reimbursement suffers. Thorough, structured clinical documentation is no longer just professional best practice. It is financial protection.
There is also a significant upside for high performers. Practices that consistently demonstrate measurable functional outcomes under VBC contracts will be rewarded with reduced prior authorization burdens. For any therapist who has spent hours writing auth appeals, had sessions denied mid-episode, or watched a child lose momentum because a payer delayed approval, that outcome is worth working toward.
What the VBC Guide Specifically Calls For
The joint guide outlines several infrastructure requirements for therapy providers preparing for value-based care. Here are the most consequential:
Objective, structured outcome measurement. The guide is explicit: quality measures require scoreable, comparable data — not narrative notes. Payers need to be able to extract, aggregate, and benchmark outcome data across providers. Narrative documentation cannot be benchmarked. Structured, scored data can.
2. Patient and caregiver-reported outcome measures. The guide specifically highlights the growing importance of capturing outcomes from the patient and family perspective — not just the clinician’s clinical observation. These measures capture health status, function, and quality of life as experienced by the people receiving care. They are becoming a required component of VBC quality scoring.
3. Longitudinal data across the full episode of care. A snapshot evaluation is not sufficient. Payers need a before and after — baseline functional status, mid-episode progress, and discharge outcome. Without that full-episode arc, there is no way to calculate the value of the intervention.
4. ICF framework for data exchange. The guide references the International Classification of Functioning, Disability, and Health — ICF — as the standard framework for exchanging functional status data across providers, settings, and payers. Providers whose documentation is built on ICF structure are already speaking the language payers are building their systems around.
5. Social determinants of health. VBC models are increasingly required to capture nonmedical factors that influence outcomes — housing stability, transportation access, food security, economic stability. These factors affect therapy outcomes and will be factored into risk adjustment models.
Why Most EMRs and EHRs Will Leave Practices Exposed
Here is the uncomfortable truth: most electronic medical records and electronic health records were built for fee-for-service. They are fundamentally accounting systems — designed to track what was billed, scheduled, and coded. They do an adequate job of supporting claims submission. They do almost nothing to capture clinical intelligence.
When value-based care contracts begin requiring structured outcome data, longitudinal functional measures, and caregiver-reported scores, practices running on a standard EMR will have nothing meaningful to submit. The documentation exists, but it is locked in narrative notes that cannot be extracted, scored, or benchmarked. That is a serious vulnerability.
The practices that will navigate this transition well are the ones that have been capturing structured, measurable clinical data all along — not because a payer required it, but because good clinical practice demanded it.
If You Are Using OT Wizard, You Are Already Ahead
OT Wizard was not built to react to value-based care. It was built on the clinical and psychometric principles that value-based care is now catching up to.
Here is how OT Wizard already delivers what the VBC guide calls for:
Objective functional outcome data. OT Wizard generates structured documentation grounded in the ICF framework — the exact standard the VBC guide identifies for measuring and exchanging outcome data. Every evaluation produces metrics on each domain, subdomain and a composite score, structured functional data, not just narrative description.
2. Caregiver and patient-reported measures. OT Wizard captures scored questionnaires from caregivers and families at baseline, mid-therapy, and discharge. That full-episode caregiver perspective is built into the platform workflow — not an add-on, not a separate form. It is the data payers will specifically look for.
3. Longitudinal data across the episode of care. Because OT Wizard tracks from intake through discharge, pre and post functional data is built into every case. That full-episode arc is what payers need to calculate a risk-adjusted performance score accurately and fairly.
This is what separates a clinical intelligence system from an accounting system. OT Wizard is not just recording what happened. It is measuring what changed.
What Is Coming Next
We are not stopping here. We are currently building Billing Wizard feature — a dedicated insurance billing feature integrated directly into OT Wizard. Your clinical outcome data and your claims will live in the same system. As value-based care contracts begin requiring outcome data alongside claims submissions, that integration will matter enormously.
And not too far away, we will develop Therapy Wizard — an expansion that will bring this same clinical intelligence foundation to speech-language therapy, physical therapy, and mental health. One platform, one outcome framework, built for the full therapy team. Because value-based care does not silo disciplines — and neither should your documentation infrastructure.
The Bottom Line
The payment landscape is changing and the timeline is real. The practices that will thrive are not the ones that scramble to retrofit their documentation after the contracts change but are the ones that already have the infrastructure in place.
If you are an OT, PT, SLP, or mental health professional asking what you can do right now: document with precision, capture complexity, measure function at intake and discharge, and make sure your platform is built to produce structured data… not just notes.
If you are a practice owner: this is an infrastructure conversation, not just a clinical one. The system you are documenting in today will determine whether you can compete for value-based contracts tomorrow.
The field is changing. OT Wizard was already here.
We Have Always Known Scissor Skills Matter. Now We Have the Numbers.
You already know scissor skills are more than a craft milestone. You know a child who cannot hold scissors with thumb up, who switches hands mid-cut, or who can barely score a line with school scissors is telling you something important about their neuromotor development. What we have not always had is the data to say exactly what they are telling us, and to show that picture to the families, teachers, and payers who need to understand it.
That is what this analysis is about.
O.T. Wizard collected structured scissor skills assessment data across 541 pediatric OT evaluations from preschool-aged children (ages 3 to 5 and a half) in North Carolina. At least 90% of children qualified for Medicaid. All were referred for OT services after failing a developmental screening. For many, OT sessions were the primary or only setting where scissors were regularly available. Teachers limit scissor time in large classroom groups. Parents restrict use at home. That context matters a lot when we look at what the data shows.
What We Measured
The O.T. Wizard Scissor Skills Assessment is a structured, scored tool built into the evaluation process. It uses a developmental progression of cutting tasks, from snipping (around 34 months) through cutting a 1/4-inch straight line (around 48 months) to cutting a 1/4-inch curvy line (around 60 months). Each task is scored on a 0 to 14 point scale using a consistent segment-by-segment rubric. Therapists also document thumb orientation, stabilizer hand, and overall hand positioning quality.
Unlike a standardized evaluation tool that captures a single snapshot in one domain, O.T. Wizard tracks performance across twelve domains simultaneously including fine motor, gross motor, visual motor integration, visual perception, activities of daily living, praxis, and executive functioning. This is what made the findings below possible. We were not just looking at how a child cuts. We were looking at what scissor skill tells us about the rest of the child.
What We Found
Scissor skill development follows a clear developmental path, and most 4-year-olds referred for OT are not yet where we would expect.
All data in this table reflects first evaluations (E1) conducted before OT intervention began. These are the starting points, the picture of where children arrived for their first evaluation. On the 1/4-inch straight line task (developmentally anchored at 48 months), here is how children in this clinical sample performed at initial evaluation:
Age Group
Avg Score /14
% Accurate
Scored Zero (0/14)
Scored Perfectly (14/14)
3:0 to 3:11 (Band G)
1.8
13%
64%
2%
4:0 to 4:5 (Band H)
4.6
33%
36%
11%
4:6 to 4:11 (Band I)
6.5
47%
18%
21%
5:0 to 5:5 (Band J)
8.1
58%
13%
27%
Table 1. Scissor skills performance on 1/4-inch straight line task at first evaluation (E1), before OT intervention. Clinical sample referred for OT evaluation. Data from O.T. Wizard, pre-normative.
At the anchor age for this task, 36% of children arrived at their first evaluation scoring zero on the 1/4-inch straight line, and another 21% scored between 1 and 3 out of 14. That means that at initial evaluation, before OT had even begun, the majority of 4-year-olds referred for services could not yet cut a 1/4-inch line with any consistency. That is not a failure of intervention. That is a description of who we serve and why they need us. And now we can describe it precisely, in numbers, instead of writing “emerging scissor skills” in a narrative.
These are clinical benchmarks for a referred population, not norms for typically developing children. They show where our kids start. That starting point is worth documenting and measuring.
The multi-task design works. Advancing to harder tasks captures the full range of scissor skill ability.
A common concern with developmental assessments is ceiling effects: what happens when a child is too skilled for the task in front of them? The data confirmed that therapists in this sample handled this correctly. Of children who scored 10 or higher on the 1/4-inch straight line task, 98% were also given the curvy line task on the same evaluation day. Among children who scored a perfect 14 on the straight line, the curvy line scores ranged across the full spectrum, averaging 8.6 out of 14 (61% accuracy). The harder task captured real, meaningful variation that the straight line task could not.
Group
n
Straight Line Avg /14
Straight Line % Accurate
Curvy Line Avg /14
Curvy Line % Accurate
Scored 10+ on straight line
165
12.5
89%
6.8
49%
Scored 14 on straight line
90
14.0
100%
8.6
61%
Table 2. Curvy line performance among children approaching or reaching ceiling on the straight line task. Confirms that advancing to the harder task captures meaningful clinical variation.
Thumb up is not just a cue. It is the difference between scissor skills and not having them.
This was the strongest predictor in the entire dataset. Hand positioning was not just associated with better cutting accuracy. It was associated with a more than 3-fold difference in performance.
Thumb Positioning
n
Avg Score /14
% Accurate
Median Score /14
Thumb-up (correct)
~270
8.2
59%
9.0
Not thumb-up
~270
2.7
19%
1.0
Table 3. Scissor skills performance by dominant hand thumb positioning. Bands G through J. Cohen d=1.17 (large effect).
Looking at Band H children specifically: among those who scored a perfect 14 on the 1/4-inch line, 89% had correct thumb-up positioning. Among those who scored zero, only 28% did. Not a single child at zero had positioning rated as “always” correct. The positioning is not the finishing touch on scissor skill development. It is the prerequisite.
For intervention planning, this data strongly supports prioritizing grip and hand orientation before focusing on line-following accuracy. Therapists who have structured treatment this way have been right all along. Now there are numbers to back it up, and to share with families and IEP teams.
Hand dominance predicts scissor skill accuracy, and the connection runs deeper than which hand holds the scissors.
Children with established hand dominance performed dramatically better on the cutting task than children with inconsistent or emerging dominance. The data below reflects all children in Bands G through J at initial evaluation.
Dominance Level
n
Avg Score /14
% Accurate
% Scored Zero
Emerging
18
1.5
11%
56%
Inconsistent
70
2.4
17%
49%
Strong preference
233
5.2
37%
28%
Established
213
7.8
56%
16%
Table 4. Scissor skills performance by documented hand dominance level at initial evaluation. Spearman rho=0.360, p<0.001.
The hand consistency finding was equally striking. Children who used the same hand for both writing and cutting averaged 7.1 out of 14 (51% accuracy). Children who used different hands for writing versus cutting averaged only 2.3 out of 14 (16% accuracy). That is a more than 3-fold performance gap, and it connects directly to the Hand Dominance article in this series.
A child who switches hands between writing and cutting is not just making an inconsistent tool choice. They are reflecting an unresolved neuromotor organization question that affects all tool use tasks. For school-based OTs, this is IEP-relevant data. Documenting hand consistency across writing and cutting tasks as part of the evaluation supports accommodation planning for the full classroom day, not just during scissor activities.
Scissor skills are a whole-body skill. The domain correlation data proves it.
This is where O.T. Wizard’s multi-domain approach made findings possible that are simply not achievable with a single standardized assessment tool that only looks at one domain or captures a single point in time.
Cutting performance was correlated against every other domain scored in the same evaluation. Here is the picture that emerged:
Domain
Correlation with Scissor Skills Score
What This Means Clinically
Fine Motor
Strong (r=0.77)
Expected: distal precision underlies cutting
Visual Motor Integration
Moderate (r=0.51)
Visual guidance is needed to follow a line
ADL (Daily Living)
Moderate (r=0.51)
Tool use skill generalizes across daily tasks
Visual Perception
Moderate (r=0.46)
Seeing and interpreting the line drives cutting accuracy
Gross Motor
Moderate (r=0.43)
Trunk and shoulder stability support distal hand control
Bilateral Integration
Moderate (r=0.40)
Confirmed: cutting is a two-handed coordinated task
Praxis
Weak-moderate (r=0.27)
Motor planning matters early; less so once the program is established
FMSAT (Fine Motor Speed and Accuracy Test)
Near zero (r=0.00)
Pencil speed and cutting accuracy are distinct skills
Table 5. Correlations between scissor skills performance (1/4-inch straight line) and O.T. Wizard domain scores. All correlations p<0.001 except FMSAT which was not significant. Bands G through J, n=454 to 541 depending on domain.
The gross motor correlation deserves a specific callout. Cutting is a distal fine motor task, but proximal stability drives distal precision. Trunk support and shoulder girdle control provide the foundation from which hand precision is expressed. A child with poor postural stability will have reduced arm control, which directly limits how precisely they can guide scissors along a line. This is the body-supports-hand principle that experienced OTs understand clinically. This dataset quantifies it.
The FMSAT finding is equally important in a different way. FMSAT “Bubble-popping” measures open-field pencil speed and precision. Scissor skills assessment measures controlled path-following with a bilateral tool. These two tasks draw on related but distinct aspects of fine motor function, and both contribute independent clinical information. Having both in the same evaluation is not redundancy. It is clinical depth.
This is the kind of cross-domain picture you cannot build from a BOT-2 or a Beery VMI alone. Those tools give you a score in an isolated domain. O.T. Wizard gives you a developmental profile across twelve domains, from the same child, on the same day, every time you complete an evaluation.
Children Made Real Progress, and OT Likely Drove Most of It.
Among the 97 children with two evaluations on file, those with scissor skills data at both time points showed an average gain of 5.2 points on the 1/4-inch straight line over an average of 4.8 months between evaluations. Nearly 70% showed improvement. However, not all of the sample had scissor related goals on their plan of care.
Measure
E1 (Before OT)
E2 (After ~5 months OT)
Gain
% Who Improved
Avg score /14 (straight line)
4.4 / 14
9.6 / 14
+5.2 pts
69.5%
% Accuracy
31%
69%
+38 pts
Avg score /14 (curvy line)
2.5 / 14
6.2 / 14
+3.8 pts
76.4%
% Accuracy (curvy)
18%
44%
+27 pts
Table 6. Scissor skills gains from initial evaluation (E1) to re-evaluation (E2). n=82 for straight line, n=72 for curvy line. Mean interval 4.8 months. Clinical sample referred for OT services.
Based on cross-sectional growth data, we would expect natural developmental growth of about 1.5 points over a 4.8-month window. These children gained 5.2 points. That is 3.7 points above the expected natural rate, representing more than triple the growth that maturation alone would predict.
And remember the context: these children were largely practicing scissor skills only during OT sessions. Teachers avoid large-group scissor time. Parents restrict home use. If nearly all scissor practice was happening in OT, and children gained more than three times the expected natural growth rate, that is meaningful evidence for OT-driven outcomes, even without a randomized controlled trial.
For school-based and medical model OTs alike, this is the kind of data that supports medical necessity, justifies continuation of services, and answers the parent question: Is this working?
What Makes This Different From a Standard Evaluation
Standardized tools like the BOT-2, PDMS-3, or Beery VMI are valuable. They are not being replaced. But they have a structural limitation: they capture performance in isolated domains, on a single day, at a single point in time. They cannot show how a child’s scissor skills score connects to their gross motor stability or ADL function. They cannot track how a child changes from evaluation to re-evaluation. And they cannot build a growing evidence base across hundreds of children that gets more precise over time.
O.T. Wizard was designed to do all of those things. Every evaluation adds to the clinical intelligence base. Scissor skills scores sit alongside fine motor, gross motor, visual perception, ADL, VMI, praxis, executive functioning, and participation data from the same child on the same day. The cross-domain correlations in this article were only possible because the platform was built to be computable, not just documentable.
This is the difference between documenting therapy and understanding it.
What This Means for Your Practice
If you work in a school setting: Scissor skills accuracy scores contextualized within a developmental progression give you IEP-ready language. A score of 4.6 out of 14 at Band H is not just “emerging” and is a measurable starting point with room to define a meaningful, achievable goal. The hand consistency finding connects directly to classroom accommodations: if a child switches hands between writing and cutting tasks, that is relevant accommodation data for the IEP team, not just a therapy note.
If you work in a medical model setting: The 5.2-point average gain over 4.8 months, in a population with almost no between-session scissor exposure, supports medical necessity documentation with concrete numbers. The cross-domain correlations support a whole-child framing in your evaluation report: scissor skills difficulty is not just a fine motor problem. It reflects neuromotor organization, visual guidance, postural stability, and bilateral coordination working together.
For both settings: Thumb-up hand positioning is the most actionable clinical target in the dataset. If thumb orientation is not being documented and targeted as a prerequisite for cutting accuracy, this data makes the case for starting there.
Scissor Skills Are the Child’s Story
A pair of scissors in a preschooler’s hand is a window. It shows you how well the brain has organized a preferred side, how the trunk is supporting the arms, how the eyes are guiding the hands, and how much the child has internalized the motor program for this specific tool. It is one of the richest clinical observations we make, and one of the least quantified.
That is changing. Data from over 500 evaluations now gives us a picture of what scissor skill development looks like in the children we actually serve, what predicts success, what domains are implicated, and what progress looks like over time. This is the beginning of an evidence base that the profession has needed.
Stephanie Seymore Wick is the Founder and Clinical Architect of O.T. Wizard, the platform from which all data in this article was collected. Data collection is ongoing under clinical quality improvement protocols. All data has been de-identified in accordance with HIPAA regulations.
About O.T. Wizard
O.T. Wizard is a clinical intelligence system for pediatric occupational therapy professionals. The platform evaluates performance in evaluations, forms, and daily treatment notes across twelve domains including visual-motor integration, fine motor skills, gross motor skills, praxis, visual perception, executive functioning, activities of daily living, and participation. O.T. Wizard is undergoing Rasch analysis validation to establish psychometrically sound, norm-referenced scoring with living norms that update continuously as the clinical database expands. Learn more at otwizard.com.
89% Improved. Five Domains Exceeded Natural Growth. Here Is What the Data Shows.
Measuring Pediatric OT Outcomes Above the Threshold of Natural Maturation
By Stephanie Seymore Wick, MSOT, OT/L | Founder and Clinical Architect, O.T. Wizard
Introduction
Every pediatric occupational therapist knows that the work they do matters. The harder question is whether the profession can show, in precise and reproducible terms, how much it matters. For decades, OT documentation has been built around goals, progress notes, and clinical narratives. These tools record care. They rarely measure change in a way that separates what the child gained through intervention from what developmental maturation would have produced on its own.
This report addresses that gap directly. Using O.T. Wizard, a clinical intelligence system designed to generate structured, reproducible, multi-domain assessment data for pediatric OT practice, we examined functional performance change across eight domains in 71 preschool-aged children who completed two full evaluations an average of 4.85 months apart.
The central question throughout this analysis is not simply whether children improved. The meaningful question is whether the children in this cohort improved beyond what developmental maturation alone would have produced over the same interval. A natural growth correction applied consistently throughout this report makes that distinction explicit in every finding.
This is the expanded replication of a February 2026 analysis of 44 paired evaluations. The findings across the 27 additional pairs are consistent with and strengthen the earlier report across all domains. The core story does not change with more data. It becomes more precise.
ABSTRACT
Background: Pediatric occupational therapy has well-established standardized tools for point-in-time measurement, including the Bruininks-Oseretsky Test of Motor Proficiency, Beery-Buktenica Developmental Test of Visual-Motor Integration, and Peabody Developmental Motor Scales-Third Edition. Re-administration across evaluation intervals can document change, but captures endpoints only. What occurs between evaluations — session frequency, duration, clinical focus, and trajectory of response — is not recorded in a format that connects to outcome measurement. Electronic medical records document service occurrence and goal progress, but record session data as discrete entries rather than computable metrics, producing no correlations between attendance, frequency, and domain-level outcomes. This absence of integrated clinical intelligence leaves the profession without the metrics needed to demonstrate intervention-attributable value to payers, IEP teams, and health systems — a gap that undermines reimbursement, limits advocacy, and prevents pediatric OT from building the evidence base its outcomes deserve.
Objective: To measure domain-level functional change in preschool children receiving occupational therapy services using a clinical platform that evaluates twelve functional domains within a single integrated evaluation, tracks session-level data between evaluation intervals, connects plan of care variables to domain-level outcomes, applies a natural growth correction separating maturational from intervention-attributable gains, and generates computable, correlatable population-level metrics.
Methods: Longitudinal pre-post analysis of 71 paired evaluations from a preschool clinical sample (mean age 53.5 months; mean interval 4.85 months; at least 90% Medicaid-qualifying). A 9.2% natural growth rate was applied as the maturational baseline. Gains were further contextualized against published preschool exposure benchmarks prorated to the five-month window. All data are pre-Rasch ordinal values.
Results: 89% of children improved in under five months. Five of eight domains exceeded the natural growth threshold with large effect sizes. VMI exceeded the published preschool exposure benchmark by d=0.92, ADL by d=0.90, and Fine Motor by d=0.65. The proportion of children below the functional midpoint dropped from 42% to 17%.
Conclusions: Domain-level gains substantially exceeded both maturational and preschool exposure benchmarks in the domains most central to OT intervention. Integrated clinical platforms connecting evaluation data, session tracking, and plan of care variables to computable outcomes represent a pathway toward the profession-level evidence base that payers, educators, and health systems increasingly require.
Study Sample
Age Distribution
The longitudinal cohort consisted of 71 preschool-aged children, each with two complete O.T. Wizard evaluations separated by a minimum of 30 days. The mean inter-evaluation interval was 4.85 months (approximately 148 days), with a range of approximately 37 to 173 days. Mean age at first evaluation was 53.5 months.
Starting age band distribution: Band G (36 to 47.99 months, n=6), Band H (48 to 53.99 months, n=29), Band I (54 to 59.99 months, n=33), and Band J (60 to 65.99 months, n=3). Bands H and I together represent 87% of the sample and are the primary basis for findings reported here. Bands G and J are included in the data but interpreted with caution given their smaller sizes.
Demographics and Clinical Status
All assessments were conducted in North Carolina through the O.T. Wizard clinical platform. Consistent with the broader software dataset, at least 90% of children qualified for Medicaid, and for many, the structured evaluation environment represented an early introduction to formal educational or clinical settings. Primary language was English for 90% of children, with 9% Spanish-speaking and 1% other. All children had been recommended for occupational therapy services following developmental screening failure.
It is important for readers to interpret these findings within this clinical context. This is not a typically developing population. These are children with identified developmental concerns who were referred for and receiving skilled OT services. Outcome findings therefore reflect the response of a clinically referred, predominantly low-income sample to structured early intervention, not population-level developmental norms.
Natural Growth Framework
Before examining domain-level findings, it is necessary to establish what score change we would expect to observe in the absence of intervention. Children in this cohort averaged 53.5 months of age at first evaluation and were reassessed approximately 4.85 months later. On a well-constructed developmental scale, maturation alone would be expected to produce a gain proportional to that age progression.
The natural growth rate for this cohort is calculated as the mean inter-evaluation interval divided by the mean age at Evaluation 1: 4.85 months divided by 53.5 months equals 9.2%. This figure represents the expected score improvement attributable to developmental maturation alone over the study period.
A gain of 9.2% would be expected from natural maturation alone over 4.85 months.Gains above 9.2% represent intervention-attributable change.
This natural growth rate serves as the reference threshold throughout this report. Domain gains below 9.2% suggest performance did not keep pace with chronological age progression. Gains at 9.2% suggest maturation-equivalent growth. Gains above 9.2% represent functional improvement beyond what age progression alone would predict.
This correction is transparent, reproducible, and requires no external normative sample to apply. It is a direct arithmetic relationship between age progression and scale progression on a fixed instrument. The Gain Above Natural column in each table makes this comparison explicit.
Research Hypotheses
Three primary hypotheses guided this analysis. First, children receiving occupational therapy services would demonstrate composite score gains substantially exceeding the 9.2% natural growth threshold. Second, domains most directly targeted by OT in preschool settings, specifically visual motor integration, fine motor skills, visual perception, and activities of daily living, would show the largest gains above expected growth. Third, Band H children (48 to 53.99 months) would demonstrate greater gains than Band I children, reflecting greater developmental sensitivity at a younger starting point.
Literature Review and Context
The preschool years represent a critical period for fine motor and visual motor development. Between the ages of three and five, neuromotor pathways underlying pencil control, bilateral coordination, and hand specialization undergo rapid maturation, establishing the foundation for academic skill development. Handwriting readiness, scissor use, and self-care independence all draw from skill sets that are most efficiently built during this developmental window.
Visual motor integration has consistently been identified as one of the strongest predictors of kindergarten handwriting readiness. Daly and colleagues (2003) found VMI performance at preschool age predicted handwriting speed and legibility at ages six and seven with effect sizes exceeding those of fine motor or visual perception measures alone. Duff and colleagues (2015) demonstrated that children with developmental coordination difficulties who receive targeted fine motor intervention during the preschool years show significantly better handwriting outcomes at school entry than matched peers without services. It is equally important to recognize that VMI does not operate in isolation as a predictor of handwriting development. Emergent literacy skills, particularly alphabet knowledge, letter-sound awareness, and early orthographic processing, are also well-established predictors of handwriting fluency and transcription accuracy (Gerde et al., 2025; Puranik et al., 2011). The relationship between literacy exposure and VMI development is bidirectional: children who are actively engaged in letter-learning and pre-writing activities in preschool settings are simultaneously building the visual discrimination, directionality, and motor planning foundations that underlie VMI performance. This intersection is clinically relevant and is acknowledged as a study limitation below.
The measurement infrastructure required to track these outcomes longitudinally has historically been a limiting factor in OT outcomes research. Standard evaluation protocols typically capture a single snapshot of performance, and re-evaluation data, when it exists, is rarely structured for computational comparison. O.T. Wizard was designed to address this gap, enabling structured, reproducible, multi-domain measurement within the constraints of a standard clinical evaluation and supporting longitudinal outcome tracking that traditional paper-based protocols do not practically support.
This report also extends a prior O.T. Wizard longitudinal analysis (Wick, 2026) that examined 44 paired evaluations from the same clinical platform. The expanded sample of 71 pairs presented here confirms and extends those findings with consistent direction and strength across all eight domains assessed.
Key Findings
Overall Composite Performance
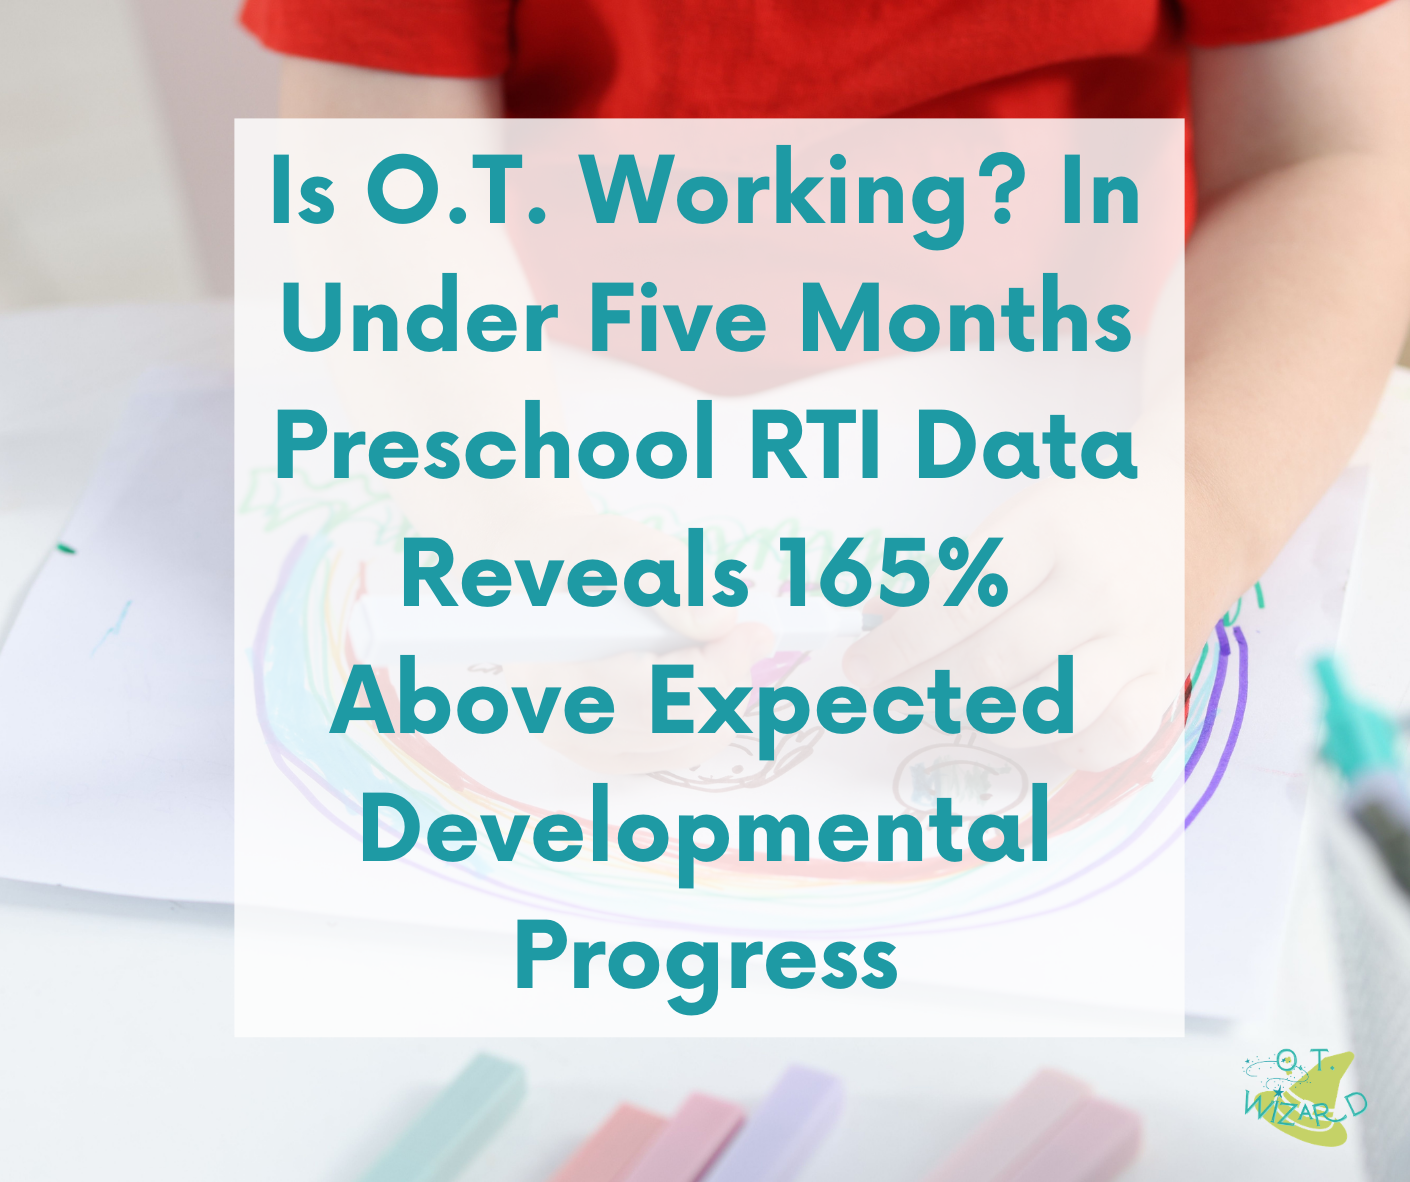
Across all 71 children with valid paired evaluations, mean composite score increased from 519.8 at Evaluation 1 to 646.0 at Evaluation 2, a mean raw gain of 126.2 points. Against the 9.2% natural growth expectation, the expected gain for this cohort was approximately 47.6 points. The observed gain exceeded the natural growth threshold by 78.6 points, representing 165% above expected developmental progress. To be precise about what that means: for every point of progress that natural maturation would have produced, these children gained 2.65 points. They moved forward at more than two and a half times the rate that developmental aging alone would have driven. That is not incremental. That is intervention doing exactly what skilled, structured, early occupational therapy is designed to do.
The gain was highly statistically significant (paired t-test, t=10.62, p<0.001, Cohen’s d=1.26, large effect). 89% of children showed improvement at the second evaluation. 42% of children began below the 500-point composite threshold; by Evaluation 2, only 17% remained below that threshold. Twenty children crossed the functional midpoint of the scale during the study interval.
89% of children improved. 20 children crossed the 500-point functional threshold.The composite gain exceeded expected natural growth by 165%.
Domain-Level Results
The following table presents results across all eight assessed domains, sorted by magnitude of gain above natural growth. All scores are pre-Rasch ordinal percentage values expressed as points within each domain’s maximum possible score. Natural Gain represents the expected gain based on the 9.2% natural growth rate applied to each domain’s Evaluation 1 mean.
Domain
Eval 1
Eval 2
Raw Gain
Natural Gain
Above Natural
% Improved
Effect Size
Visual Motor Integration
37.6
62.2
+24.6
3.4
+21.1 (614%)
94%
d=1.49 (Large)
Activities of Daily Living
45.5
69.2
+23.7
4.2
+19.5 (468%)
87%
d=1.27 (Large)
Fine Motor Skills
47.7
63.7
+16.0
4.3
+11.6 (268%)
86%
d=1.00 (Large)
Gross Motor Skills
56.8
72.3
+15.5
5.2
+10.3 (198%)
73%
d=0.77 (Medium)
Visual Perception
62.7
75.1
+12.4
5.7
+6.7 (118%)
77%
d=0.74 (Medium)
Praxis
52.1
56.6
+4.5
4.8
-0.3 (-6%)
48%
d=0.15 (ns)
Participation
65.2
69.4
+4.2
6.0
-1.8 (-30%)
62%
d=0.26 (*)
Executive Functioning
63.7
66.2
+2.5
5.8
-3.4 (-57%)
52%
d=0.15 (ns)
Table 1. Domain-level longitudinal comparison. Scores are points within each domain’s maximum possible score. Natural Gain = Eval 1 mean x 9.2% natural growth rate. Above Natural = Raw Gain minus Natural Gain. Effect sizes: Large (d>0.8), Medium (d>0.5). Executive Functioning, Participation, and Praxis findings are addressed in the discussion section. All scores are pre-Rasch raw values.
Visual Motor Integration produced the largest gain above expected growth in the dataset, rising from 37.6 to 62.2 points, a raw gain of 24.6 points against an expected natural gain of 3.4 points. The gain above natural growth was 21.1 points, representing 614% above what maturation alone would have produced. 94% of children with VMI scores showed improvement. The effect size of d=1.49 is considered large by conventional standards.
Activities of Daily Living showed a raw gain of 23.7 points against a natural expectation of 4.2 points, placing the gain above natural growth at 19.5 points (468% above expected). Fine Motor Skills showed 11.6 points above the natural expectation (268% above expected, d=1.00, large). Gross Motor Skills showed 10.3 points above expected (198% above expected, d=0.77, medium). Visual Perception showed 6.7 points above expected (118% above expected, d=0.74, medium).
Praxis, Participation, and Executive Functioning showed gains at or below the natural growth threshold, none with statistically significant large effects. The interpretation of these findings requires clinical context and is discussed in detail below. A dedicated companion analysis of the Participation and Executive Functioning longitudinal findings is forthcoming in this research series, as the novelty effect hypothesis and its implications for clinical documentation merit extended treatment.
Performance by Starting Age Band
The following table presents composite score change by starting age band. Natural growth rates vary slightly by band because younger children have a larger age progression ratio over the same elapsed time. Bands G and J are included for completeness but should be interpreted with caution given small sample sizes.
Age Band
n
Eval 1 Mean
Eval 2 Mean
Raw Gain
Above Natural
NGR
G (36-47.99 mo)
6
394.7
496.3
+101.7
+57.0
11.3%
H (48-53.99 mo)
29
516.6
651.3
+134.8
+84.8
9.7%
I (54-59.99 mo)
33
542.7
670.2
+127.5
+81.9
8.4%
J (60-65.99 mo)
3
549.7
628.0
+78.3
+32.8
8.3%
Table 2. Composite score change by starting age band. NGR = natural growth rate (months elapsed / age at Eval 1). Above Natural = Raw Gain minus (Eval 1 mean x NGR). Bands G and J interpreted with caution (small n).
Band H children (ages 48 to 53.99 months) showed the largest absolute gains above natural growth, averaging 84.8 points above the natural expectation on a composite gain of 134.8 points. Band I children showed 81.9 points above expected on a composite gain of 127.5 points. Both primary age bands show gains well above the natural growth threshold, and the difference between them is modest. This is broadly consistent with the earlier 44-pair analysis, which found Band H slightly outperforming Band I. The 48 to 54 month window continues to appear as a period of high clinical yield for OT service delivery, though both bands show substantial responsiveness.
Understanding the Flat Domains: Praxis, Participation, and Executive Functioning
Three domains showed gains at or below the natural growth threshold: Praxis (-6%), Participation (-30%), and Executive Functioning (-57%). These findings are clinically important to interpret carefully, as they do not simply mean that OT failed to produce change in these areas.
For Praxis, the near-zero gain is more likely a reflection of current measurement sensitivity than true insensitivity to intervention. Praxis is a complex, context-dependent construct requiring the integration of motor planning, bilateral coordination, and sequencing across novel tasks. Detecting incremental praxis development over a five-month interval likely requires either longer measurement windows or more precisely calibrated items. Rasch calibration of the praxis item bank is a priority in the continuing research agenda.
Participation and Executive Functioning tell a more nuanced story that involves the measurement context itself. Both domains are rated by the therapist based on behavioral observation during the evaluation. At Evaluation 1, the child is meeting the therapist for the first time. The novelty of the interaction, the structured environment, and the desire to engage with an unfamiliar adult may produce elevated ratings that reflect situational compliance rather than the child’s authentic behavioral baseline. By Evaluation 2, the therapeutic relationship is established and the child is comfortable enough to reveal their genuine regulatory and engagement patterns, including the variability and difficulty that characterize their daily functioning. If Evaluation 1 ratings are systematically elevated by this novelty effect, the apparent absence of gain at Evaluation 2 reflects a measurement context shift rather than a failure of intervention. A dedicated research blog on the novelty effect hypothesis and its implications for clinical documentation is forthcoming in this series.
Correlation Analysis
A moderate negative correlation was observed between starting composite score and magnitude of change (consistent with the 44-pair analysis). Children who began with lower scores tended to show larger gains. This regression-to-the-mean effect is expected in clinical samples and does not invalidate the findings, but is an important interpretive consideration. No significant correlation was found between inter-evaluation interval length and change score, indicating that the range of intervals in this cohort (approximately 37 to 173 days) did not materially influence the magnitude of observed gains.
Implications for OT Practice
The domain-level findings interpreted through the natural growth framework allow occupational therapists to make specific, evidence-informed decisions about evaluation and intervention priorities. Five domains showed gains ranging from 118% to 614% above the 9.2% natural growth threshold, all with statistical significance and large or medium effect sizes. These gains were achieved in a predominantly Medicaid-qualifying, low-income clinical population with significant developmental concerns, which makes the magnitude of change all the more clinically meaningful.
For insurance authorization and educational planning, the natural growth framework provides a communication tool that is both precise and accessible. Rather than reporting a raw score change, the practitioner can state that the child’s VMI performance exceeded the expected developmental rate by 21.1 points over approximately five months, providing clear evidence that skilled OT intervention, not maturation, drove the observed change. This framing is methodologically transparent and directly responsive to the medical necessity standards that payers apply.
The composite score threshold finding carries particular weight for authorization purposes. A child who begins services below the 500-point composite threshold and crosses it during the authorization period has demonstrated objectively measurable functional change. Of the 30 children who began below 500 points, 20 crossed that threshold during the study interval. That is a two-thirds success rate in moving children from below-threshold to at-threshold performance within a single authorization period.
Serial assessments using a consistent instrument also generate slope data that goes beyond a single outcome comparison. The rate of gain above natural growth, calculated at the domain level, can be used to project whether a child is on track to reach functional goals within a given authorization period, supporting proactive communication with payers and educational teams before a plateau needs to be explained rather than after.
Implications for Intervention Planning
The convergent large effect sizes across VMI, ADL, Fine Motor, and Gross Motor domains point toward a functional skill cluster that is highly responsive to structured OT programming during the preschool developmental window. These four domains share underlying requirements for postural control, bilateral coordination, and visually guided hand movement. Interventions that integrate these components across functional activities are supported by both the data pattern and established OT theory.
The Gross Motor finding is particularly relevant for intervention sequencing. A gain of 10.3 points above natural expectation with a medium-to-large effect confirms that proximal postural and movement foundations are responsive to OT services alongside distal fine motor work. For children showing limited fine motor or VMI gains, postural foundation and gross motor assessment should be considered before concluding that the upper extremity is the primary limiting factor.
For children whose evaluation profiles show strength in Gross Motor relative to Fine Motor and VMI, a proximal-to-distal intervention sequence may accelerate gains across the entire cluster. The strength of the ADL finding (d=1.27) reflects the functional integration that OT uniquely provides: when children gain in fine motor, VMI, and postural control simultaneously, daily living skills follow as a natural downstream effect.
The flat findings for Praxis, Participation, and Executive Functioning should not reduce the clinical attention given to these areas. They reflect current measurement constraints rather than evidence of non-response to intervention. Goal writing in these domains should continue, supported by structured therapist observation and emerging platform tools designed to capture behavioral change over longer intervals.
Study Limitations
This study carries several important limitations that readers should consider when interpreting and applying the findings.
The sample is clinical and geographically restricted to North Carolina. Findings cannot be generalized to typically developing children or to populations in other regions with different demographic profiles, service delivery models, or referral criteria. The absence of a control group means observed gains cannot be causally attributed to OT intervention. Natural maturation, regression to the mean, and test familiarity effects each contribute to observed change scores to an unknown degree.
The 9.2% natural growth correction is a methodologically transparent estimate derived directly from the age progression of this cohort on this instrument. It assumes proportional developmental scaling across the score range, an assumption that Rasch calibration will allow us to test empirically. Future work with a typically developing comparison group will allow domain-specific, empirically derived growth expectations to replace this uniform estimate.
The regression-to-the-mean effect means that domains with the lowest Evaluation 1 scores (VMI, ADL, Fine Motor) also showed the largest gains. The true intervention effect within these domains is likely substantial, but the proportion attributable to treatment versus regression toward the mean cannot be fully separated without a control group. All scores remain pre-Rasch ordinal percentage values. Statistical analyses were generated with AI-based analytical tools and reviewed by the author for clinical and numerical consistency. Final responsibility for interpretation rests with the author.An additional and important limitation specific to the VMI domain is the potential confounding effect of preschool attendance and literacy instruction.
A significant body of research demonstrates that access to quality preschool accelerates cognitive and academic skill development, with effects that are particularly pronounced for children from low-income households (Magnuson & Duncan, 2016; Bailey et al., 2024). Preschool curricula in the four-year-old age range routinely incorporate letter recognition, alphabet knowledge, pre-writing activities, and structured fine motor practice, all of which directly engage the visual-motor and orthographic processing skills that O.T. Wizard’s VMI domain measures. Because O.T. Wizard does not currently collect data on whether a child is enrolled in preschool, how many days per week they attend, or what literacy instruction they are receiving, it is not possible to separate the contribution of preschool-based literacy exposure from the contribution of OT services to the VMI gains observed. The large VMI gains reported here almost certainly reflect the combined influence of OT intervention, natural maturation, and classroom-based literacy and pre-writing instruction. Future data collection that captures school enrollment status and attendance patterns would allow this important confounder to be examined directly.
Band G (n=6) and Band J (n=3) findings should be treated as exploratory only. The Participation and Executive Functioning longitudinal findings are subject to the novelty effect interpretation described above, which cannot be confirmed or ruled out without the prospective study design described in the continuing research section.
Continuing Research Needed
Rasch calibration remains the highest research priority for O.T. Wizard. Transforming ordinal raw scores into interval-level person measures will allow true scale-independent longitudinal comparison, validate the proportional scaling assumption underlying the natural growth correction, and identify items requiring revision. Current analyses are pre-Rasch and should be interpreted as preliminary clinical evidence rather than psychometrically standardized measurement. The O.T. Wizard National Try-Out Team initiative is designed to expand sample sizes needed for stable item calibration across all domains and age bands.
A typically developing comparison group would allow the 9.2% natural growth estimate to be validated empirically and replaced with domain-specific growth expectations calibrated against external developmental benchmarks. Recruiting a non-clinical sample, even a modest one, would strengthen the interpretive framework considerably and provide a more precise foundation for the gain-above-expected metric.
The novelty effect hypothesis for Participation and Executive Functioning requires prospective investigation. A study design capturing therapist-rated engagement and work habits at multiple time points within the first year of services, alongside parent-reported and teacher-reported measures, would allow empirical testing of whether first-evaluation ratings systematically overestimate authentic baseline functioning.
Longitudinal expansion with test-retest intervals of 12 to 24 months would allow examination of whether early VMI and ADL gains are sustained through kindergarten entry, and whether children who make the largest gains above natural growth in the preschool period show measurably better school readiness outcomes. Linking O.T. Wizard composite and domain scores to standardized criterion measures, including teacher-rated school readiness and kindergarten entry assessments, would establish predictive validity and position the platform’s data within the broader early childhood outcomes literature.
Conclusion
This analysis of 71 preschool-aged children with paired O.T. Wizard evaluations, examined through a transparent natural growth framework, extends the domain-level outcome picture established in the February 2026 report. Across a mean interval of 4.85 months and a natural growth expectation of 9.2%, five of eight assessed domains showed gains that were statistically significant, clinically large in effect, and substantially above what maturation alone would produce.
89% of children improved overall. 20 children crossed the 500-point composite functional threshold during the study interval. Visual Motor Integration showed gains of 21.1 points above the natural expectation, 614% above what developmental maturation alone would predict over the same period. Activities of Daily Living and Fine Motor Skills showed gains of 468% and 268% above expected, respectively. These are not marginal differences. They represent functional gains at rates that developmental maturation cannot explain.
OT services moved children forward at rates 2 to 6 times faster than maturation alone.
These findings are preliminary. They require replication with larger samples, validated comparison conditions, and Rasch-calibrated measurement. What they establish is that structured domain-level digital assessment in pediatric OT can generate longitudinal outcome data that clearly and transparently distinguishes intervention-driven change from natural maturation. For a profession that has historically struggled to quantify its impact in terms that payers and educational systems recognize, that distinction is not a minor technical refinement. It is the foundation of evidence-based practice.
A six-part blog series examining what outcome data reveals about pediatric OT, what documentation systems currently miss, and how structured Response to Intervention measurement changes clinical practice is forthcoming in the O.T. Wizard Research Series beginning the week of March 9, 2026.
Disclosures
The author is the Founder and Clinical Architect of O.T. Wizard and has a financial interest in the platform. All analyses were conducted on de-identified clinical data collected in routine practice. Statistical analyses were generated with AI-based analytical tools and reviewed by the author for clinical accuracy and numerical consistency. Final responsibility for interpretation and reporting rests with the author. Data collection is ongoing. All data is de-identified in accordance with HIPAA regulations.
References
Daly, C. J., Kelley, G. T., & Krauss, A. (2003). Relationship between visual-motor integration and handwriting skills of children in kindergarten: A modified replication study. American Journal of Occupational Therapy, 57(4), 459-462. https://doi.org/10.5014/ajot.57.4.459
Duff, S. V., Chow, S. M., & Henderson, S. E. (2015). Developmental coordination disorder and its consequences for children. In A. F. Farrow & P. J. Tremblay (Eds.), Pediatric rehabilitation: Principles and practice (5th ed., pp. 189-215). Demos Medical Publishing.
Zwicker, J. G., Missiuna, C., Harris, S. R., & Boyd, L. A. (2012). Developmental coordination disorder: A review and update. European Journal of Paediatric Neurology, 16(6), 573-581. https://doi.org/10.1016/j.ejpn.2012.05.003Bailey, D. H., Duncan, G. J., Cunha, F., Foorman, B. R., & Yeager, D. S. (2024). Persistence and fadeout of educational-intervention effects: Mechanisms and potential solutions. Psychological Science in the Public Interest, 21(2), 55-116.Gerde, H. K., Zhao, Y., Shu, L., & Gagne, J. R. (2025). Evidence-based instructional support for early writing in preschool and kindergarten: A scoping review. Reading and Writing. https://doi.org/10.1007/s11145-025-10751-8Magnuson, K., & Duncan, G. J. (2016). Can early childhood interventions decrease inequality of economic opportunity? RSF: The Russell Sage Foundation Journal of the Social Sciences, 2(2), 123-141.
About O.T. Wizard
O.T. Wizard is a clinical intelligence system for pediatric occupational therapy professionals. The platform evaluates performance in evaluations, forms, and daily treatment notes across twelve domains including visual-motor integration, fine motor skills, gross motor skills, praxis, visual perception, executive functioning, activities of daily living, and participation. O.T. Wizard is undergoing Rasch analysis validation to establish psychometrically sound, norm-referenced scoring with living norms that update continuously as the clinical database expands. For information about O.T. Wizard research or accessing the platform, visit otwizard.com.