Pencils, Scissors, and Getting Dressed: Measuring What OT Actually Changes Across Nine Functional Domains in Preschool Children
O.T. Wizard Clinical Research Series
By Stephanie Seymore Wick MSOT, OT/L | Occupational Therapist & Clinical Architect, O.T. Wizard
Introduction
Ask any pediatric occupational therapist whether their work makes a difference, and the answer is immediate and unequivocal. Ask them to produce the numbers that prove it, and the conversation becomes considerably more complicated. OT practice has long operated in a documentation environment built around goals, progress notes, and clinical narratives, all of which are essential but none of which readily yield the kind of quantitative, domain-level outcome data that payers, school teams, and researchers increasingly require.
This study represents an effort to change that. Using O.T. Wizard, a clinical intelligence system designed to generate structured, reproducible, multi-domain assessment data for pediatric OT practice, we examined performance change across nine functional domains and fourteen subdomains in 44 preschool-aged children who completed two full evaluations approximately five months apart.
A central methodological commitment in this report is transparency about what the observed gains actually represent. All percentage changes are gains from the child’s own baseline score. To help readers interpret these figures, we apply a straightforward age-based natural growth correction throughout: children in this cohort averaged 54.2 months at first evaluation and were reassessed approximately 4.7 months later. On a well-constructed developmental scale, maturation alone would be expected to produce a gain proportional to that age progression, approximately 8.7 percent (4.7 divided by 54.2). Gains above that threshold represent performance beyond what developmental maturation alone would predict. Every table in this report includes both the total observed gain and the gain above this expected growth rate, allowing readers to evaluate the data with appropriate context.
Study Sample
Age Distribution
The longitudinal cohort consisted of 44 preschool-aged children, each with two complete O.T. Wizard evaluations separated by a minimum of 28 days. Three additional pairs were excluded due to inter-evaluation intervals of fewer than 28 days. The mean inter-evaluation interval was 141.7 days, approximately 4.7 months, with a range of 56 to 169 days. Mean age at first evaluation was 54.2 months, range 44 to 60 months. Mean age at second evaluation was 58.9 months.
Starting age band distribution: Band G (36 to 47.99 months, n=2), Band H (48 to 53.99 months, n=18), Band I (54 to 59.99 months, n=22), and Band J (60 to 65.99 months, n=2). Bands H and I together accounted for 91 percent of the sample.
Demographics and Clinical Status
The sample was evenly distributed by gender with 22 females and 22 males. All assessments were conducted in North Carolina through O.T. Wizard’s clinical network. Consistent with the broader platform dataset, at least 90 percent of children qualified for Medicaid. The primary referring diagnosis was Specific Developmental Disorder of Motor Function (ICD-10: F82). All children had been recommended for occupational therapy services following developmental screening failure.
A critical methodological strength of this dataset is rater consistency: 43 of 44 pairs, or 98 percent, were evaluated by the same therapist at both time points, using identical items, response scales, and scoring weights. This same-instrument, same-rater design substantially reduces the risk that observed score changes reflect measurement variability rather than true functional change.
Natural Growth Framework
Expected natural growth over the 4.7-month study interval: 8.7% (calculated as 4.7 months / 54.2 months mean age at Evaluation 1)
Before presenting findings, it is important to establish what we would expect to observe even without intervention. A child who matures from 54.2 months to 58.9 months of age has progressed approximately 8.7 percent through the developmental continuum captured by the instrument. This expected gain is attributable to natural maturation and applies regardless of clinical status. It requires no external literature to defend: it is a direct arithmetic relationship between age progression and scale progression on a fixed instrument.
This 8.7 percent figure serves as the reference threshold throughout this report. Domain gains below 8.7 percent suggest development did not keep pace with chronological age progression. Gains equal to 8.7 percent suggest maturation-equivalent growth. Gains above 8.7 percent represent functional improvement beyond what age progression alone would predict, and are therefore the most meaningful indicator of intervention impact. The Gain Above Expected column in each table makes this comparison explicit for every domain and subdomain assessed.
Research Hypotheses
Three primary hypotheses guided this analysis. First, children receiving occupational therapy services would demonstrate composite score gains substantially exceeding the 8.7 percent expected natural growth threshold. Second, domains most directly targeted by OT in preschool settings, specifically visual motor integration, fine motor skills, visual perception, and activities of daily living, would show the largest gains above expected growth. Third, Band H children (48 to 53.99 months) would demonstrate greater gains than Band I children, reflecting greater developmental sensitivity at a younger starting point.
Brief Literature Review and Context
The preschool years represent a critical window for fine motor and visual motor development. Prerequisite skills for handwriting, scissor use, and self-care begin consolidating between ages three and five, with neuromotor pathways underlying pencil control and bilateral coordination undergoing rapid maturation during this period. Interventions delivered during this window have the potential to alter developmental trajectories in ways that become substantially more difficult to achieve once children enter formal schooling.
Visual motor integration has been identified as one of the strongest predictors of kindergarten handwriting readiness. Daly and colleagues (2003) found that VMI performance at preschool age predicted handwriting speed and legibility at ages six to seven, with effect sizes exceeding those of fine motor or visual perception measures alone. Duff and colleagues (2015) demonstrated that children with developmental coordination disorder who receive targeted fine motor intervention during the preschool years show significantly better handwriting outcomes at school entry than matched peers without services, underscoring the importance of early, precisely measured intervention.
The measurement infrastructure required to track these outcomes longitudinally has historically been a limiting factor in OT outcomes research. O.T. Wizard was designed to address this gap, enabling structured, reproducible multi-domain measurement within the constraints of a standard clinical evaluation and supporting the kind of longitudinal outcome tracking that traditional paper-based protocols make impractical.
Key Findings
Composite Score: Overall Outcome
Across all 44 children, mean composite score increased from 502.9 at Evaluation 1 to 609.7 at Evaluation 2, a mean gain of 106.8 points representing 21.2 percent growth from baseline. Against the expected natural growth rate of 8.7 percent, this represents a gain of 12.5 percent above what maturation alone would predict. The difference was highly statistically significant (paired t-test, p < 0.001, Cohen’s d = 0.98). Thirty-six of 44 children (82 percent) showed improvement at the second evaluation.
Total composite gain: +21.2% | Expected natural growth: +8.7% | Gain above expected: +12.5%
Domain-Level Findings
The following table presents results across all seven skill-based assessed domains. Participation and Executive Functioning are addressed separately below, as their measurement properties during first-time evaluations warrant distinct interpretive considerations.
| Domain | n | Eval 1 | Eval 2 | Total Gain | Gain Above Expected (8.7%) | p-value | Cohen’s d |
|---|---|---|---|---|---|---|---|
| Visual Motor Integration | 43 | 36.0 | 61.3 | +70.1% | +61.4% | < 0.001 | 1.38 (Large) |
| Activities of Daily Living | 37 | 44.4 | 64.2 | +44.8% | +36.1% | < 0.001 | 1.17 (Large) |
| Fine Motor Skills | 39 | 45.6 | 58.8 | +28.8% | +20.1% | < 0.001 | 0.85 (Large) |
| Gross Motor Skills | 43 | 55.9 | 72.6 | +30.0% | +21.3% | < 0.001 | 0.82 (Large) |
| Visual Perception | 41 | 61.4 | 72.9 | +18.8% | +10.1% | < 0.001 | 0.69 (Medium) |
| Praxis | 44 | 51.7 | 51.9 | +0.4% | -8.3% | 0.964 | 0.01 (Negligible) |
Table 1. Domain-level longitudinal comparison. Scores are percentage of maximum possible. Gain Above Expected subtracts the 8.7% natural growth threshold from total observed gain. Shaded rows reached statistical significance. All scores are pre-Rasch raw percentage values. Participation and Executive Functioning appear in dedicated sections below.

Visual Motor Integration produced the largest gain in the dataset, rising from 36.0 to 61.3, a total gain of 70.1 percent from baseline representing 61.4 percent above expected natural growth. Children who began with VMI performance at barely more than one-third of expected capacity exited the study interval having crossed the functional midpoint of the scale. Activities of Daily Living showed 36.1 percent above expected growth (d=1.17). Fine Motor Skills and Gross Motor Skills each exceeded 20 percent above expected, with large effect sizes. Visual Perception showed 10.1 percent above expected growth with a medium-to-large effect.
Praxis fell below the expected natural growth threshold with a negative Gain Above Expected value. This is interpreted as a measurement sensitivity question as much as a treatment response question: Praxis is a complex, context-dependent construct that may require longer intervention timelines, different assessment approaches, or Rasch-calibrated items to detect meaningful change over five months.
Subdomain-Level Findings
Subdomain-level analysis reveals where within each domain gains were concentrated and adds clinical texture to the domain-level picture.
| Subdomain | n | Eval 1 | Eval 2 | Total Gain | Gain Above Expected (8.7%) | p-value | Cohen’s d |
|---|---|---|---|---|---|---|---|
| WAND-PreK Handwriting | 40 | 37.3 | 63.5 | +70.1% | +61.4% | < 0.001 | 1.18 (Large) |
| Dressing | 43 | 44.8 | 63.1 | +40.8% | +32.1% | < 0.001 | 1.06 (Large) |
| Hand Use | 44 | 53.1 | 68.8 | +29.6% | +20.9% | < 0.001 | 1.03 (Large) |
| Trunk Stability | 44 | 56.1 | 73.2 | +30.4% | +21.7% | < 0.001 | 0.84 (Large) |
| Scissor Use | 44 | 36.0 | 59.5 | +65.5% | +56.8% | < 0.001 | 0.84 (Large) |
| Complex Visual Motor Representation | 44 | 30.9 | 52.3 | +69.1% | +60.4% | < 0.001 | 0.80 (Large) |
| Bilateral Integration | 43 | 49.6 | 63.6 | +28.1% | +19.4% | < 0.001 | 0.71 (Medium) |
| Visual Discrimination | 44 | 66.6 | 80.6 | +21.0% | +12.3% | < 0.001 | 0.59 (Medium) |
| Visual Figure Ground | 43 | 69.3 | 82.6 | +19.1% | +10.4% | 0.006 | 0.44 (Small) |
| Visual Memory | 42 | 56.1 | 65.5 | +16.8% | +8.1% | 0.054 | 0.31 (Small, ns) |
| Visual Spatial Relations | 42 | 53.1 | 61.6 | +16.1% | +7.4% | 0.143 | 0.23 (Small, ns) |
| Sequencing Praxis | 44 | 51.7 | 51.9 | +0.4% | -8.3% | 0.964 | 0.01 (Negligible) |
Table 2. Subdomain-level longitudinal comparison. Sorted by effect size. Gain Above Expected subtracts the 8.7% natural growth threshold. Shaded rows reached statistical significance (p < 0.05). All scores are pre-Rasch raw percentage values.

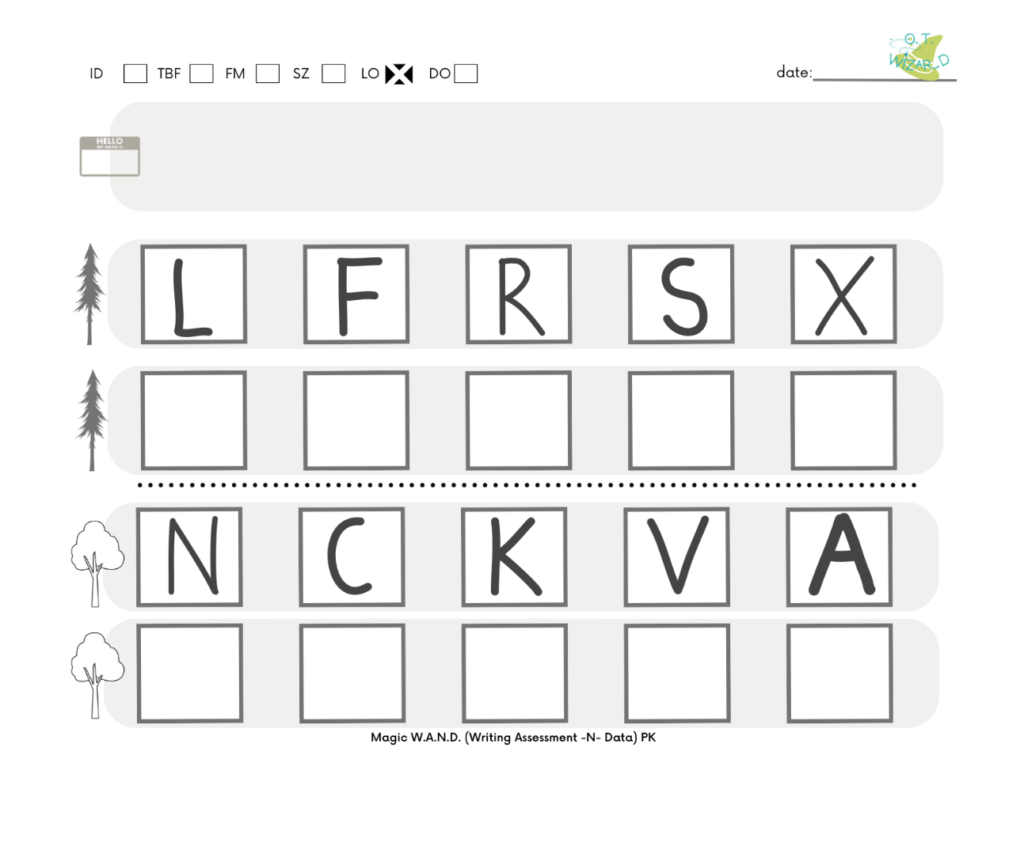
WAND-PreK Handwriting showed the largest subdomain effect size (d=1.18, p<0.001), with 61.4 percent above expected growth. Children who began with pre-writing performance at 37.3 percent of expected reached 63.5 percent after approximately five months of OT services. Scissor Use showed 56.8 percent above expected growth, rising from a mean of 36.0 to 59.5. Complex Visual Motor Representation showed 60.4 percent above expected. These three findings converge on a single clinical message: the VMI domain gain is not abstract. It is translating directly into the functional pre-academic tasks that define preschool readiness.
Hand Use (20.9% above expected, d=1.03), Dressing (32.1% above expected, d=1.06), and Trunk Stability (21.7% above expected, d=0.84) all showed large effect sizes with direct functional implications for classroom participation and daily independence. Bilateral Integration showed 19.4 percent above expected growth, consistent with bilateral coordination emerging as a measurable downstream benefit of fine motor and VMI development.
Visual Memory and Visual Spatial Relations showed gains of 8.1 and 7.4 percent above expected growth respectively, neither reaching statistical significance. These findings are consistent with prior O.T. Wizard analyses suggesting these constructs require longer measurement intervals or refined item calibration.
Performance by Starting Age Band
| Starting Band | n | Eval 1 Mean | Eval 2 Mean | Point Change | Composite % Gain |
|---|---|---|---|---|---|
| G (36-47.99 mo) | 2 | 408.0 | 421.0 | +13.0 | +3.2% |
| H (48-53.99 mo) | 18 | 461.4 | 591.2 | +129.7 | +28.1% |
| I (54-59.99 mo) | 22 | 531.2 | 639.1 | +108.0 | +20.3% |
| J (60-65.99 mo) | 2 | 659.5 | 642.0 | -17.5 | -2.7% |
Table 3. Composite score change by starting age band. Bands G and J should be interpreted with caution due to small sample sizes (n=2 each).
Band H children (ages 48 to 53.99 months) showed the largest absolute gains, averaging 129.7 points or 28.1 percent composite growth, more than three times the 8.7 percent natural growth expectation. Band I children averaged 20.3 percent composite growth, also substantially above expectation. These findings support Hypothesis 3 and suggest that the 48 to 54 month window may represent a particularly high-yield period for OT service delivery in this population.
Correlation Analysis
A significant negative correlation was observed between starting composite score and magnitude of change (r=-0.32, p=0.032), consistent with a regression-to-the-mean effect. Children who began with lower scores tended to show larger gains. This is expected in any clinical sample and does not invalidate the findings, but it is an important consideration when interpreting the highest-gain domains, which also tended to have the lowest Evaluation 1 starting scores. No significant correlation was found between inter-evaluation interval length and change score (r=0.05, p=0.742), nor between starting age and change score (r=-0.10, p=0.518).
A Closer Look: Bilateral Fine Motor Speed and Hand Dominance Development
The Fine Motor Speed and Accuracy task, referred to in O.T. Wizard, as the FMSAT (Fine Motor Speed and Accuracy) “Bubble Popping” assessment, requires children to use a pencil to puncture as many small circles as possible in 30 seconds, first with their preferred hand and then with the other hand. The two bubble counts are recorded separately, capturing not just fine motor speed in isolation but the functional relationship between dominant and non-dominant hand performance.
This bilateral structure means the Speed and Accuracy results cannot be interpreted as a simple pre-post longitudinal measure in the same way as other subdomains. Instead, the raw hand-level bubble counts offer a window into two parallel developmental processes: absolute fine motor speed improvement in each hand, and the widening of the performance gap between hands as hand dominance consolidates.
| Measure | n | Eval 1 | Eval 2 | Change | % Change | p-value | Cohen’s d |
|---|---|---|---|---|---|---|---|
| Hand 1 (Dominant) – bubbles popped | 39 | 15.3 | 18.8 | +3.4 | +22.4% | 0.002 | 0.52 (Medium) |
| Hand 2 (Non-dominant) – bubbles popped | 39 | 10.4 | 12.4 | +2.0 | +18.9% | 0.100 | 0.27 (Trending) |
| Dominance gap (H1 minus H2) | 39 | 4.90 | 6.36 | +1.46 | — | 0.324 | 0.16 (Hypothesis-generating) |
Table 4. Bilateral fine motor speed longitudinal analysis. Bubble counts reflect circles punctured in 30 seconds per hand. Dominance gap = Hand 1 minus Hand 2. Natural growth expectation: 8.7%.
The dominant hand showed a statistically significant gain of 3.44 bubbles (p=0.002, d=0.52), representing 22.4 percent improvement from baseline, well above the 8.7 percent natural growth expectation. The non-dominant hand showed a trending gain of 1.97 bubbles (p=0.10, d=0.27), representing 18.9 percent improvement, also above the natural growth threshold. Both hands therefore showed above-expected growth, with the dominant hand improving at a meaningfully faster rate.
The performance gap between hands widened directionally from 4.90 bubbles at Evaluation 1 to 6.36 bubbles at Evaluation 2, a gap change of 1.46 bubbles. This did not reach statistical significance at n=39 (p=0.324), which is expected: the O.T. Wizard hand dominance study required 348 children to detect a gap change of 0.73 bubbles over six months. At n=39, detecting a 1.46 bubble gap change requires larger samples than this longitudinal cohort provides. The finding is directionally consistent and hypothesis-generating rather than confirmatory.
Contextualizing these findings against the O.T. Wizard hand dominance study adds clinical depth. That analysis of 459 children found that children with established hand dominance showed a mean inter-hand gap of 4.55 bubbles, while children with no clear dominance showed only a 0.73 bubble gap. The current longitudinal cohort entered with a gap of 4.90 bubbles, already at the established-dominance level, and exited with a gap of 6.36 bubbles. This suggests that OT services may be supporting continued hand specialization beyond initial dominance establishment, driving the dominant hand to further advantage through targeted fine motor programming. Confirmation requires larger samples but the pattern is coherent with motor learning theory and with the hand dominance findings published separately in this research series.
Participation: Domain-Level Engagement Ratings
O.T. Wizard captures participation separately from skill performance through nine domain-specific engagement ratings, each scored on a five-point scale from No Engagement to Excellent Engagement. These ratings ask the evaluating therapist to rate how the child engaged during that domain’s evaluation tasks, creating a domain-matched engagement record that parallels the skill score data.
Rather than treating participation as a single aggregated outcome domain comparable to VMI or Fine Motor Skills, this report presents participation data as a construct validity and clinical context measure. The central question is whether children who perform better in a given skill domain also engage more fully during that domain’s assessment tasks. The answer, consistently across all four matched domains analyzed, is yes.
| Skill Domain | Participation Matched Rating | Pearson r | Spearman rho | p-value | n |
|---|---|---|---|---|---|
| Visual Motor Integration | PART_VM | 0.317 | 0.301 | < 0.001 | 465 |
| Visual Perception | PART_VP | 0.481 | 0.464 | < 0.001 | 444 |
| Activities of Daily Living | PART_ADL | 0.497 | 0.506 | < 0.001 | 445 |
| Gross Motor Skills | PART_GM | 0.465 | 0.459 | < 0.001 | 468 |
Table 5. Domain-matched skill score versus domain-specific participation rating correlations. All correlations significant at p < 0.001.
The overall composite skill score correlates with composite participation ratings at r=0.762 (p<0.001, n=469), a strong relationship that confirms participation ratings are not arbitrary. Children with higher functional skill levels are rated as more engaged during assessment tasks, and this relationship holds across domains. For VMI specifically, children in the lowest skill tertile received a mean VM participation rating of 3.42, while children in the highest skill tertile averaged 4.06. The proportion rated Good or Excellent engagement rose from 46.7 percent in the lowest VMI group to 82.9 percent in the highest.
These correlations serve as an important construct validity signal for the platform. A child’s competence in a domain predicts their engagement during that domain’s evaluation tasks, which is precisely what developmental and occupational therapy theory would predict. Skill and participation are not independent; they reinforce each other, and O.T. Wizard’s measurement structure captures that relationship.
The Novelty Effect Hypothesis and Longitudinal Participation
The longitudinal cohort of 44 children showed a composite participation gain from 61.0 to 63.1 over five months, a change that was not statistically significant (p=0.394, d=0.13). This result warrants careful interpretation rather than the conclusion that participation did not improve with OT services.
A clinically grounded alternative explanation is the novelty effect. At Evaluation 1, the child is meeting the therapist for the first time. The environment is new, the tasks are novel, and the structured one-on-one interaction may naturally elicit high cooperative behavior. Participation ratings at Eval 1 may therefore reflect novelty-driven engagement rather than the child’s true baseline functional participation. By Evaluation 2, the therapeutic relationship is established, the child is comfortable enough to reveal authentic behavioral and engagement patterns, and the therapist has sufficient rapport to observe the child’s genuine participation profile rather than their best performance.
If this hypothesis holds, Evaluation 1 participation ratings are systematically inflated relative to what they would show in a familiar context, meaning the scale at Evaluation 2 is measuring a meaningfully different construct than at Evaluation 1. This measurement context shift would explain the apparent lack of longitudinal gain without implying that participation failed to respond to intervention. It also opens a question with direct clinical and psychometric implications: are participation ratings most informative when collected after the therapeutic relationship is established, and should baseline participation norms account for the evaluative context?
This remains a hypothesis requiring empirical testing with larger longitudinal samples. It is noted here as both a study limitation and a direction for continuing research.
Executive Functioning: Work Habits Observed During Evaluation
The Executive Functioning domain in O.T. Wizard is assessed through the Work Habits in a 1:1 Therapy Setting subdomain, comprising eight items: Attention, Cooperation, Task Initiation, Task Persistence, Task Completion, Transition, Impulse Control, and Carryover of Skills. Each item is rated on a five-point scale from Not Present/Unable to Proficient, with ratings reflecting the child’s behavior as observed during the evaluation itself.
Across the full cross-sectional sample of 471 children, Work Habits items showed mean ratings ranging from 3.32 for Attention to 4.10 for Task Completion, indicating that the majority of children in this clinical population demonstrated adequate to proficient work habits during the evaluation. The EF Work Habits composite score correlates with overall composite skill performance at r=0.759 (p<0.001), a relationship comparable in strength to the participation-skill correlation. Higher-functioning children, as measured by composite skill scores, are observed to demonstrate better work habits during assessment.
Item-level correlations with specific skill domains add clinical texture. Attention correlates with VMI performance at r=0.324 and with Fine Motor at r=0.413. Task Initiation shows r=0.351 with VMI and r=0.456 with Fine Motor. Task Persistence correlates at r=0.447 with Fine Motor. These moderate relationships are consistent with the theoretical link between executive function and fine motor learning: children who can attend, initiate, and persist through structured tasks acquire fine motor skills more efficiently, and children with stronger fine motor programs may experience less frustration-driven task avoidance.
The Novelty Effect in Executive Functioning
The longitudinal cohort showed near-zero change in Executive Functioning from Evaluation 1 to Evaluation 2 (+0.5%, p=0.916, d=0.02). The same novelty effect hypothesis that applies to participation applies here with equal force, and arguably with stronger clinical support.
A child encountering a new therapist in a structured evaluation setting has strong situational motivators for compliance: the novelty of the interaction, the desire to please an unfamiliar adult, and the absence of habituated behavioral patterns in that specific context. Cooperation, Impulse Control, and Task Persistence at Evaluation 1 may reflect the child’s best-case executive behavior under novel conditions rather than their typical regulatory profile. By Evaluation 2, these situational scaffolds have diminished. The child knows the therapist, has formed expectations about the session, and is more likely to exhibit their authentic regulatory patterns, including the attentional variability, transition difficulty, or impulse control challenges that characterize their daily functioning.
If Evaluation 1 Work Habits ratings are inflated by novelty effects and Evaluation 2 ratings reflect more authentic behavioral observation, then the absence of longitudinal gain is not evidence that OT failed to improve executive functioning. It may instead reflect the instrument now measuring what it was designed to measure. This interpretation has a meaningful implication for clinical documentation: therapist-observed Work Habits ratings collected after the therapeutic relationship is established may provide more valid clinical and baseline data than those collected at first encounter.
As with participation, this hypothesis requires prospective testing with larger samples and ideally with parent-reported or teacher-reported behavioral measures to establish convergent validity across contexts. It is presented here as a clinically grounded interpretive framework and a research priority.
Implications for OT Practice
The domain-level findings, interpreted through the natural growth framework, allow occupational therapists to make specific, evidence-informed decisions about evaluation and intervention priorities. Five domains showed gains ranging from 10.1 to 61.4 percent above the 8.7 percent natural growth rate, all with statistical significance and large or medium effect sizes. These gains were achieved in a predominantly Medicaid-qualifying, low-income clinical population with significant developmental concerns, which makes the magnitude of change all the more clinically meaningful.
The VMI finding demands particular attention in practice planning. A gain of 61.4 percent above expected natural growth indicates that children receiving OT services made VMI gains at roughly eight times the rate that maturation alone would predict over the same interval. Given VMI’s established role as a predictor of kindergarten handwriting readiness, prioritizing VMI-targeted activities including complex copying tasks, directed drawing, and structured pre-writing programs is strongly supported by this data.
For insurance authorization and educational planning, the natural growth framework provides a uniquely effective communication tool. Rather than reporting a raw score gain, the practitioner can state that the child’s VMI performance exceeded the expected developmental rate by 61 percentage points over five months, providing clear evidence that skilled OT intervention, not maturation, drove the observed change. This framing is defensible, transparent in its methodology, and directly responsive to the kind of medical necessity standard that payers apply.
The bilateral fine motor speed findings support continued OT intervention targeting hand specialization in children whose dominance is still consolidating. The dominant hand’s significant gain above natural growth, combined with the directional widening of the inter-hand gap, is consistent with OT services accelerating hand specialization. For children presenting with inter-hand gaps below two bubbles at preschool age, more intensive hand-specific programming may be clinically warranted.
The participation and work habits findings carry a practical message for therapist documentation practice. Domain-specific participation ratings that are collected after the therapeutic relationship is established are likely to be more clinically informative than those captured at first evaluation. Therapists should be aware that novelty effects at initial evaluation may produce elevated engagement and compliance ratings that do not generalize to the child’s authentic daily functioning profile.
Implications for Intervention Planning
The convergent gains across WAND-PreK Handwriting, Scissor Use, Complex VMI, Hand Use, Bilateral Integration, and Trunk Stability point toward a functional fine motor and VMI cluster that is highly responsive to structured OT programming in this developmental window. Gains in this cluster ranged from 19.4 to 61.4 percent above expected growth. Interventions that integrate tool use, bilateral coordination, and visual guidance of hand movements across this cluster are supported by both the data pattern and established OT theory.
The Trunk Stability findings reinforce a foundational clinical principle: proximal postural control precedes and supports distal fine motor development. Children who gained in trunk stability tended to gain across the fine motor and VMI cluster. For children showing limited fine motor or VMI gains, postural foundation assessment and intervention should be considered before assuming the upper extremity is the primary limiting factor.
Scissor use showed 56.8 percent above expected growth with a large effect size. Scissors require bilateral coordination, hand differentiation, VMI guidance, and sustained attention simultaneously, making scissor-based activities a naturally integrative target across multiple domains. The large effect size and high gain above expected growth suggest this subdomain is both highly responsive to OT intervention and highly sensitive to measurement, making it a valuable progress-monitoring target.
For Praxis, intervention targeting should not be abandoned based on the longitudinal findings reported here. The near-zero gain more likely reflects current measurement limitations than true insensitivity to OT services. As O.T. Wizard’s item bank is refined through Rasch calibration, this domain may demonstrate the sensitivity needed to capture incremental change that OT practitioners observe clinically.
The domain-matched participation correlations support incorporating participation-focused goal setting alongside skill-based goals, particularly for children showing low engagement in specific domains. A child rated at Minimal Engagement in VMI activities is likely showing competence-related avoidance rather than willful noncompliance, and addressing the underlying skill deficit is the most direct route to improved participation in that domain.
Study Limitations
This study carries several important limitations. The sample is clinical and geographically restricted to North Carolina, and findings cannot be generalized to typically developing children or populations in other regions. The absence of a control group means observed gains cannot be causally attributed to OT intervention.
The 8.7 percent natural growth correction applied throughout this report is a methodologically transparent and defensible estimate derived directly from the age progression of this cohort on this instrument. It assumes proportional developmental scaling across the score range, an assumption that Rasch calibration will allow us to test empirically. Future work with a typically developing comparison group will allow domain-specific, empirically derived growth expectations to replace this uniform estimate, strengthening the interpretive framework considerably.
The regression-to-the-mean effect (r=-0.32) means children with lower starting scores showed larger gains on average. Visual Motor Integration, WAND-PreK Handwriting, Scissor Use, and Complex VMI all had the lowest Evaluation 1 scores and the largest gains above expected growth. The true intervention effect within these domains is likely substantial, but the proportion attributable to treatment versus regression toward the mean cannot be fully separated without a control group.
Participation and Executive Functioning longitudinal findings are subject to a novelty effect interpretation that cannot be confirmed or ruled out with the current dataset. The possibility that Evaluation 1 ratings in these domains reflect novelty-driven behavior rather than true baseline functioning represents a meaningful threat to the internal validity of longitudinal comparisons in these areas specifically. This does not affect the skill-domain findings but warrants dedicated investigation in future work.
The bilateral fine motor speed gap-widening finding is hypothesis-generating at n=39 and requires larger samples to reach significance. Bands G and J contained only two children each, precluding any band-specific inference for those age ranges. All scores remain pre-Rasch ordinal percentage values. Statistical analyses were generated with the assistance of an AI-based analytical tool and reviewed by the author for clinical and numerical consistency. Final responsibility for interpretation and reporting rests with the author.
Continuing Research Needed
Rasch calibration remains the highest research priority. Transforming ordinal raw scores into interval-level person measures will allow true scale-independent longitudinal comparison, validate the proportional scaling assumption underlying the natural growth correction, and identify items requiring revision. The O.T. Wizard National Try-Out Team initiative is designed to accelerate this process by expanding the sample sizes needed for stable item calibration across all domains and age bands.
A comparison group of typically developing children will allow the 8.7 percent natural growth estimate to be validated empirically and replaced with domain-specific growth expectations calibrated against external developmental benchmarks. This will strengthen the natural growth framework applied in this report and make the gain-above-expected metric more precise for insurance and educational reporting contexts.
The novelty effect hypothesis for participation and executive functioning requires prospective investigation. A study design that captures therapist-rated participation and work habits at multiple time points within the first year of services, alongside parent-reported and teacher-reported behavioral measures, would allow empirical testing of whether first-evaluation ratings systematically overestimate engagement and compliance relative to ratings collected after therapeutic relationship establishment. Confirming or disconfirming this hypothesis has implications for how O.T. Wizard instructs therapists to interpret and apply participation and EF data in clinical documentation.
The domain-matched participation correlations reported here establish a foundation for construct validity research. Future work linking participation ratings to standardized adaptive behavior measures and teacher-rated classroom engagement would extend these findings and position the participation ratings as clinically actionable data rather than descriptive context.
The bilateral fine motor speed findings warrant dedicated follow-up with larger samples. Testing whether inter-hand gap widening reaches significance at n=100 or greater, whether gap widening correlates with therapist-documented hand dominance establishment, and whether children who begin with gaps below two bubbles show different intervention trajectories would substantially extend the hand dominance research program established in the O.T. Wizard FMSAT study.
Linking O.T. Wizard performance data to standardized criterion measures including the Beery VMI, BOT-2, and teacher-rated school readiness indicators would establish concurrent and predictive validity, and would allow the natural growth framework applied here to be calibrated against externally validated developmental benchmarks.
Conclusion
This analysis of 44 preschool-aged children with paired O.T. Wizard evaluations, examined through a transparent natural growth framework, provides the most complete domain-level longitudinal outcome picture generated by the platform to date. The expected natural growth rate of 8.7 percent over the 4.7-month study interval serves as a consistent interpretive reference throughout, allowing readers to distinguish maturation from intervention-attributable change across every domain reported.
The findings are striking. Five of seven skill domains showed gains substantially exceeding the 8.7 percent natural growth threshold, with effect sizes ranging from medium to large. Visual Motor Integration showed gains 61.4 percent above expected. WAND-PreK Handwriting showed gains 61.4 percent above expected. Scissor Use showed gains 56.8 percent above expected. These are not marginal differences from expectation. They represent functional gains at rates six to eight times what chronological maturation alone would produce over the same interval.
The domain-matched participation analysis adds a construct validity dimension to these findings. Children who perform better in a skill domain engage more fully during that domain’s assessment, with domain-matched correlations ranging from r=0.317 to r=0.497 and an overall composite skill-participation correlation of r=0.762. Participation and executive functioning longitudinal data are reframed here through the novelty effect hypothesis, which proposes that first-evaluation ratings in these behavioral domains may reflect situational compliance rather than authentic baseline functioning, with more valid observational data emerging after the therapeutic relationship is established.
The FMSAT (“Bubble Popping”) extends these findings into hand dominance development, showing that the dominant hand improved significantly above the natural growth rate and that the inter-hand performance gap widened directionally, consistent with progressive hand specialization during OT services.
These findings are preliminary. They require replication with larger samples, validated comparison conditions, and Rasch-calibrated measurement. What they establish is that structured domain-level digital assessment in pediatric OT can generate longitudinal outcome data that clearly and transparently distinguishes intervention-driven change from natural maturation. For a profession that has historically struggled to quantify its impact in terms that payers and educational systems recognize, that distinction is not a minor technical refinement. It is the foundation of evidence-based practice. O.T. Wizard is building that foundation, one evaluation at a time.
Disclosures
The author is the founder of O.T. Wizard and has a financial interest in the platform. All analyses were conducted on de-identified clinical data collected in routine practice.
References
Daly, C. J., Kelley, G. T., & Krauss, A. (2003). Relationship between visual-motor integration and handwriting skills of children in kindergarten: A modified replication study. American Journal of Occupational Therapy, 57(4), 459-462. https://doi.org/10.5014/ajot.57.4.459
Duff, S. V., Chow, S. M., & Henderson, S. E. (2015). Developmental coordination disorder and its consequences for children. In A. F. Farrow & P. J. Tremblay (Eds.), Pediatric rehabilitation: Principles and practice (5th ed., pp. 189-215). Demos Medical Publishing.
Zwicker, J. G., Missiuna, C., Harris, S. R., & Boyd, L. A. (2012). Developmental coordination disorder: A review and update. European Journal of Paediatric Neurology, 16(6), 573-581. https://doi.org/10.1016/j.ejpn.2012.05.005
Polatajko, H. J., & Cantin, N. (2010). Exploring the effectiveness of occupational therapy interventions, other than the sensory integration approach, with children and adolescents experiencing difficulty processing and integrating sensory information. American Journal of Occupational Therapy, 64(3), 415-429. https://doi.org/10.5014/ajot.2010.09073
About O.T. Wizard
O.T. Wizard is a clinical intelligence system for pediatric occupational therapy professionals. The platform evaluates performance in evaluations, forms, and daily treatment notes across twelve domains including visual-motor integration, fine motor skills, gross motor skills, praxis, visual perception, executive functioning, activities of daily living, and participation. OT Wizard is undergoing Rasch analysis validation to establish psychometrically sound, norm-referenced scoring with living norms that update continuously as the clinical database expands.
Data collection is ongoing. All data is de-identified in accordance with HIPAA and FERPA regulations.For information about O.T. Wizard research or accessing the platform, visit otwizard.com